Question
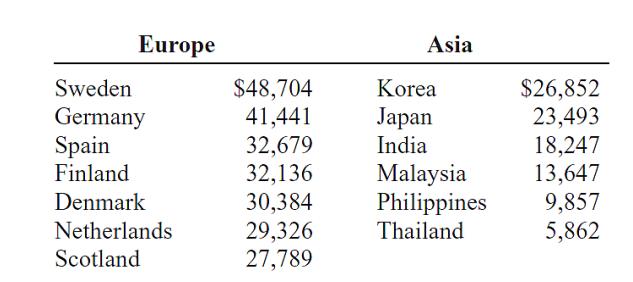
3. Starting teachers salaries (in equivalent U.S. dollars) for upper secondary education in selected countries are listed below. Which set of data is more variable?

3. Starting teachers’ salaries (in equivalent U.S. dollars) for upper secondary education in selected countries are listed below. Which set of data is more variable? (The U.S. average starting salary at this time was $29,641.)

4. Which has a better relative position: a score of 75 on a statistics test with a mean of 60 and a standard deviation of 10 or a score of 36 on an accounting test with a mean of 30 and a variance of 16? Justify your answer.
5. The data represent the values in billions of dollars of the damage of 10 hurricanes.
1.1, 1.7, 1.9, 2.1, 2.2, 2.5, 3.3, 6.2, 6.8, 20.3
a. What is the percentile rank of 20.3?
b. What value corresponds to the 40th percentile?
6. The average height of a certain age group of people is 53 inches. The standard deviation is 4 inches. If the variable is normally distributed, find the probability that a selected individual’s height will be a. Greater than 59 inches b. Less than 45 inches
7. An educator wants to see how the number of absences for a student in her class affects the student’s final grade. The data obtained from a sample are shown.

Do a complete regression analysis by performing these steps.
a. Draw a scatter plot.
b. Compute the correlation coefficient.
c. Test the significance of the correlation coefficient @ a= 0.05
d. Determine the regression line equation.
e. Interpret the results.
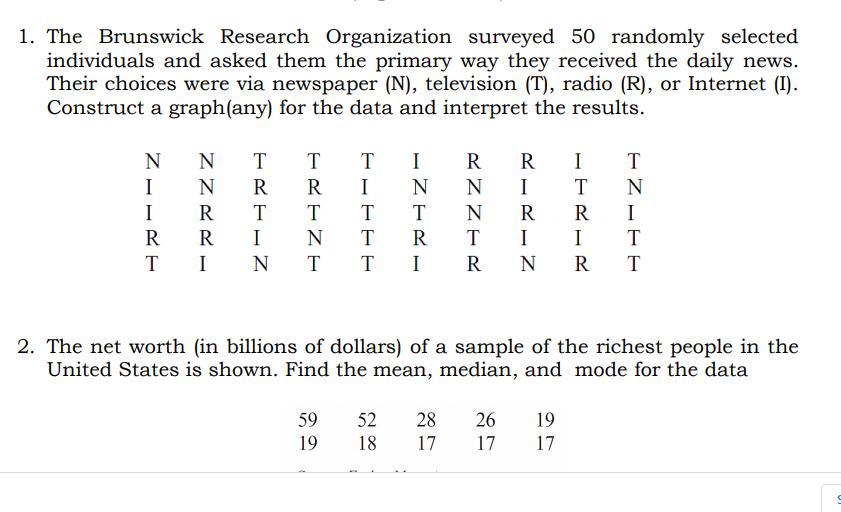
1. The Brunswick Research Organization surveyed 50 randomly selected individuals and asked them the primary way they received the daily news. Their choices were via newspaper (N), television (T), radio (R), or Internet (I). Construct a graph(any) for the data and interpret the results. N N T T I R I R I T T T I N I T I R I T R N R R R N T R T I T T I 2. The net worth (in billions of dollars) of a sample of the richest people in the United States is shown. Find the mean, median, and mode for the data 59 52 28 26 19 19 18 17 17 17 TNITT RNNTR TRTIZ Z ZRR
Step by Step Solution
3.52 Rating (166 Votes )
There are 3 Steps involved in it
Step: 1
1 Data Frequency N 10 T 16 R 12 I 12 Graph 18 16 14 E F 12 10 P Q X Y B C A D G H J S W Z N T R I Sc...
Get Instant Access to Expert-Tailored Solutions
See step-by-step solutions with expert insights and AI powered tools for academic success
Step: 2

Step: 3

Ace Your Homework with AI
Get the answers you need in no time with our AI-driven, step-by-step assistance
Get Started


