Answered step by step
Verified Expert Solution
Question
1 Approved Answer
(1) The Bureau of Economic Analysis (BEA) replaced gross national product (GNP) with gross domestic product (GDP) as an update to the National Income


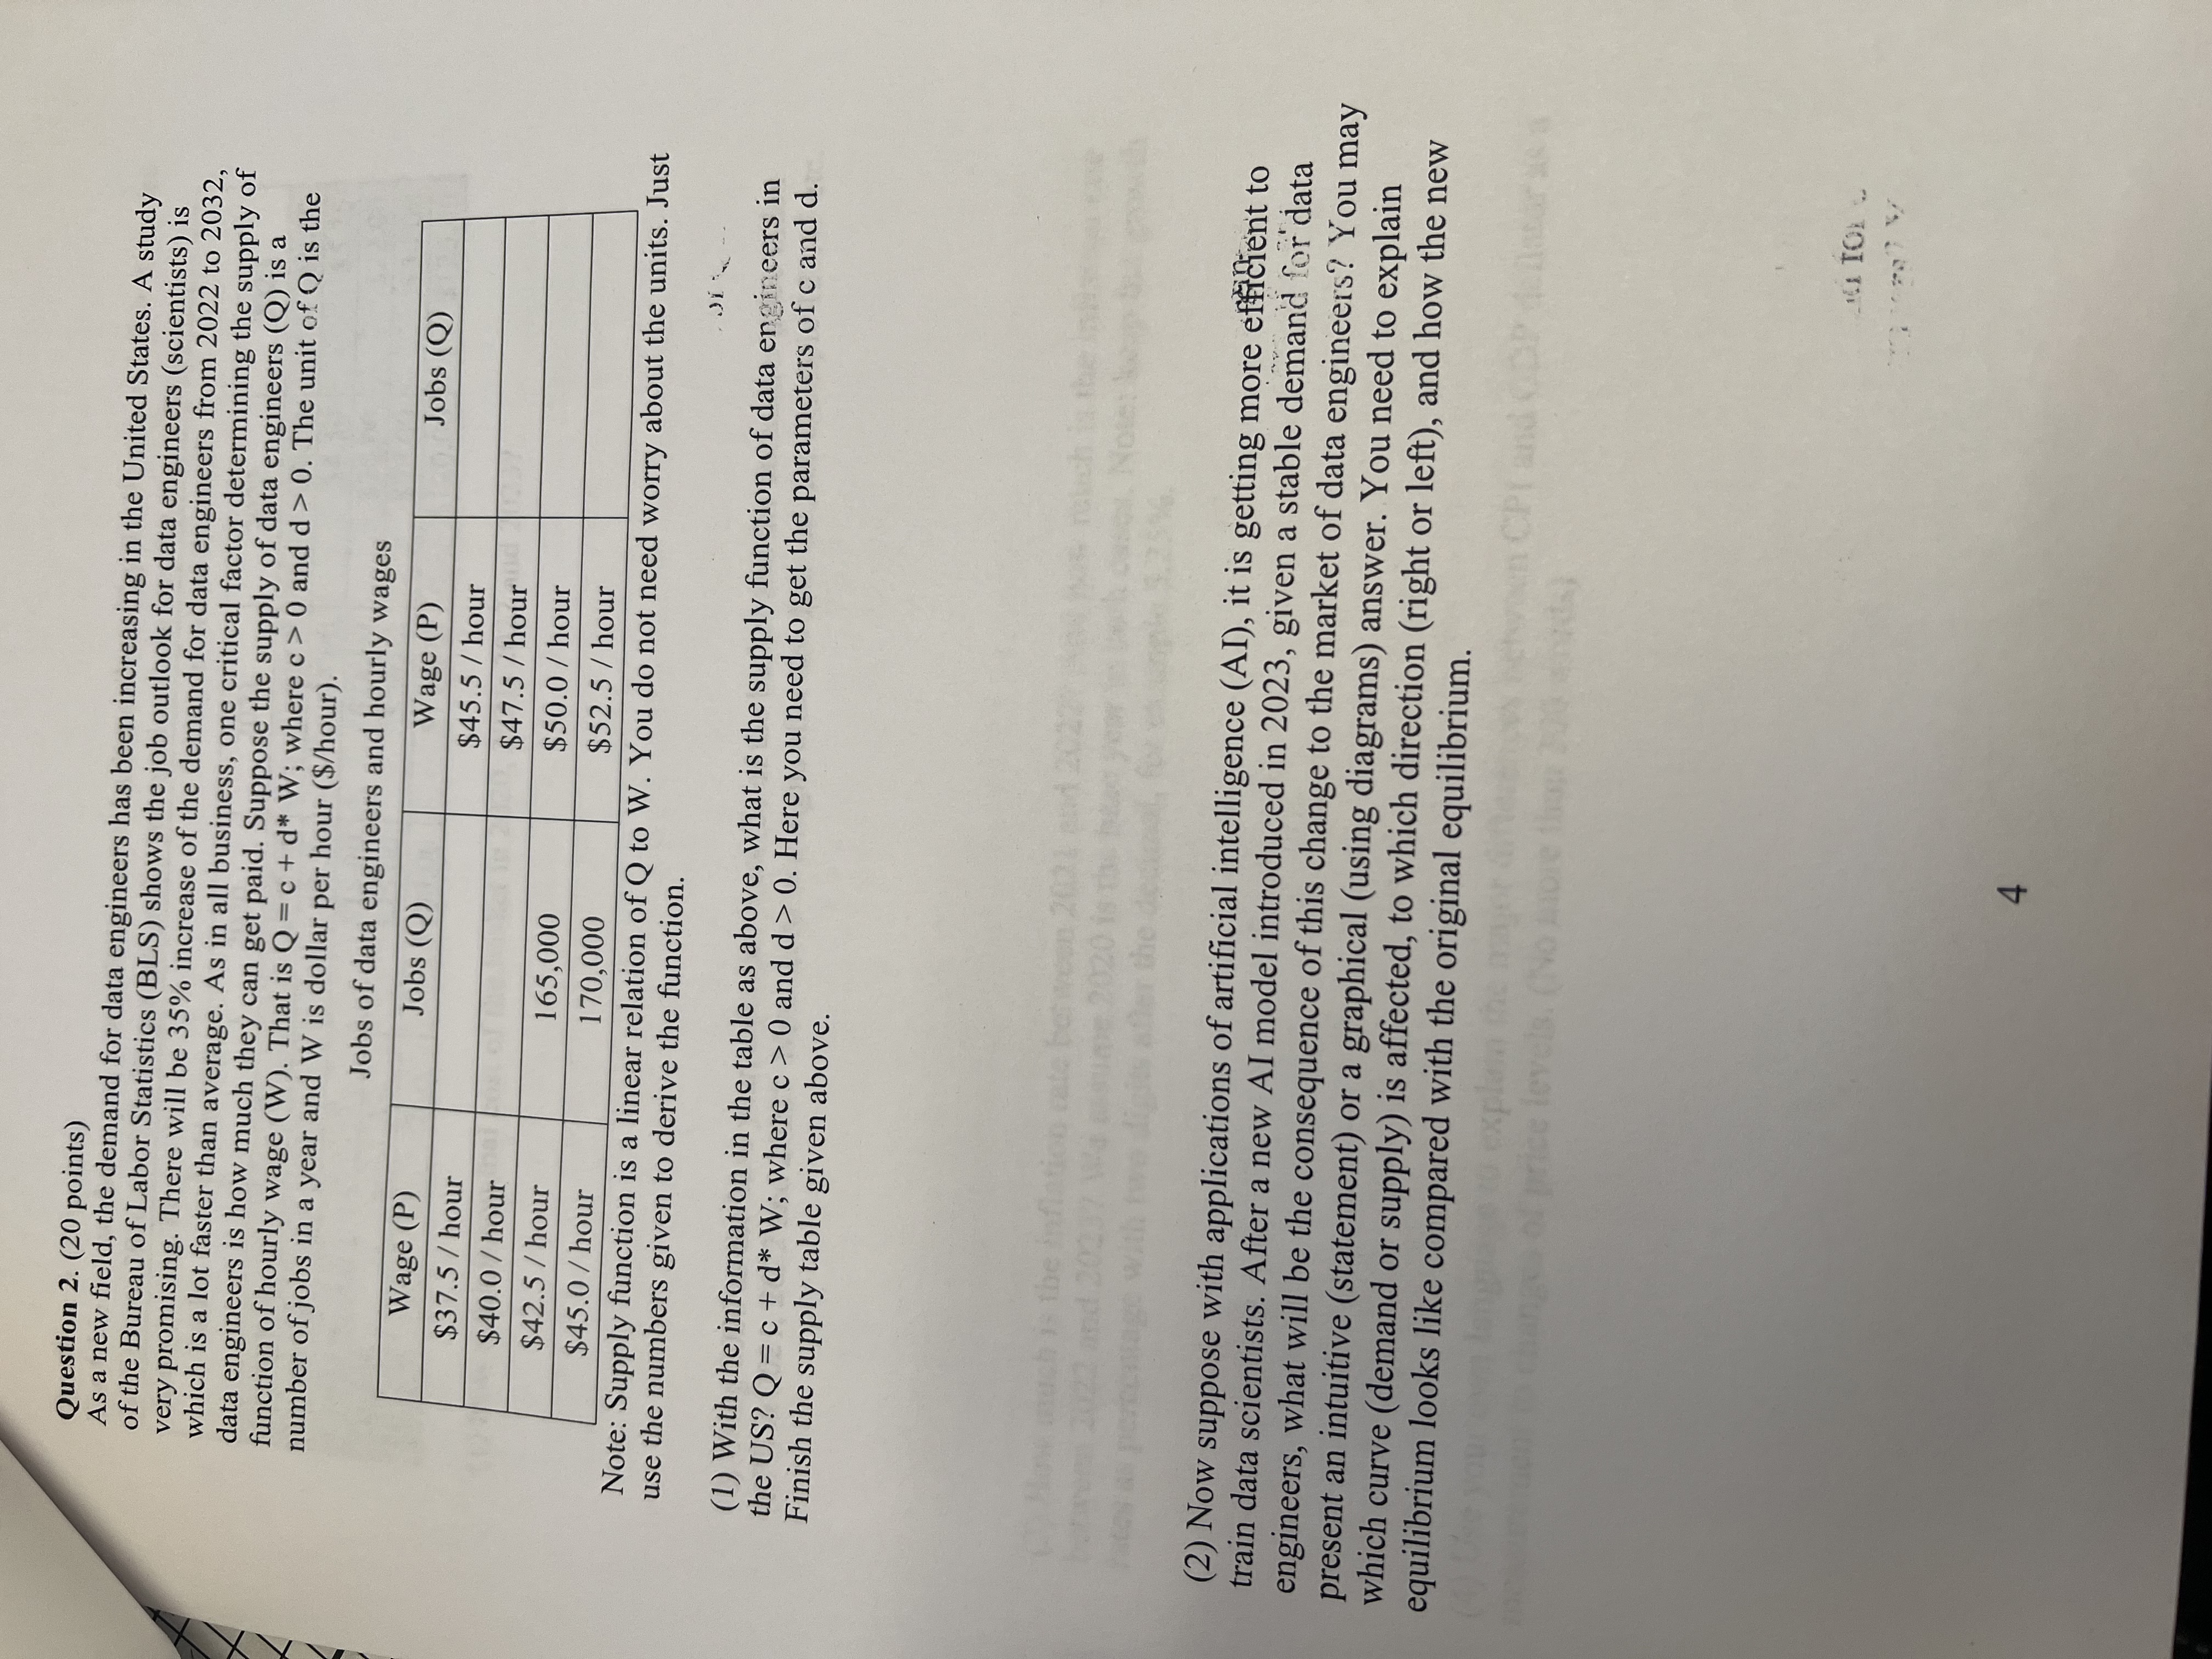
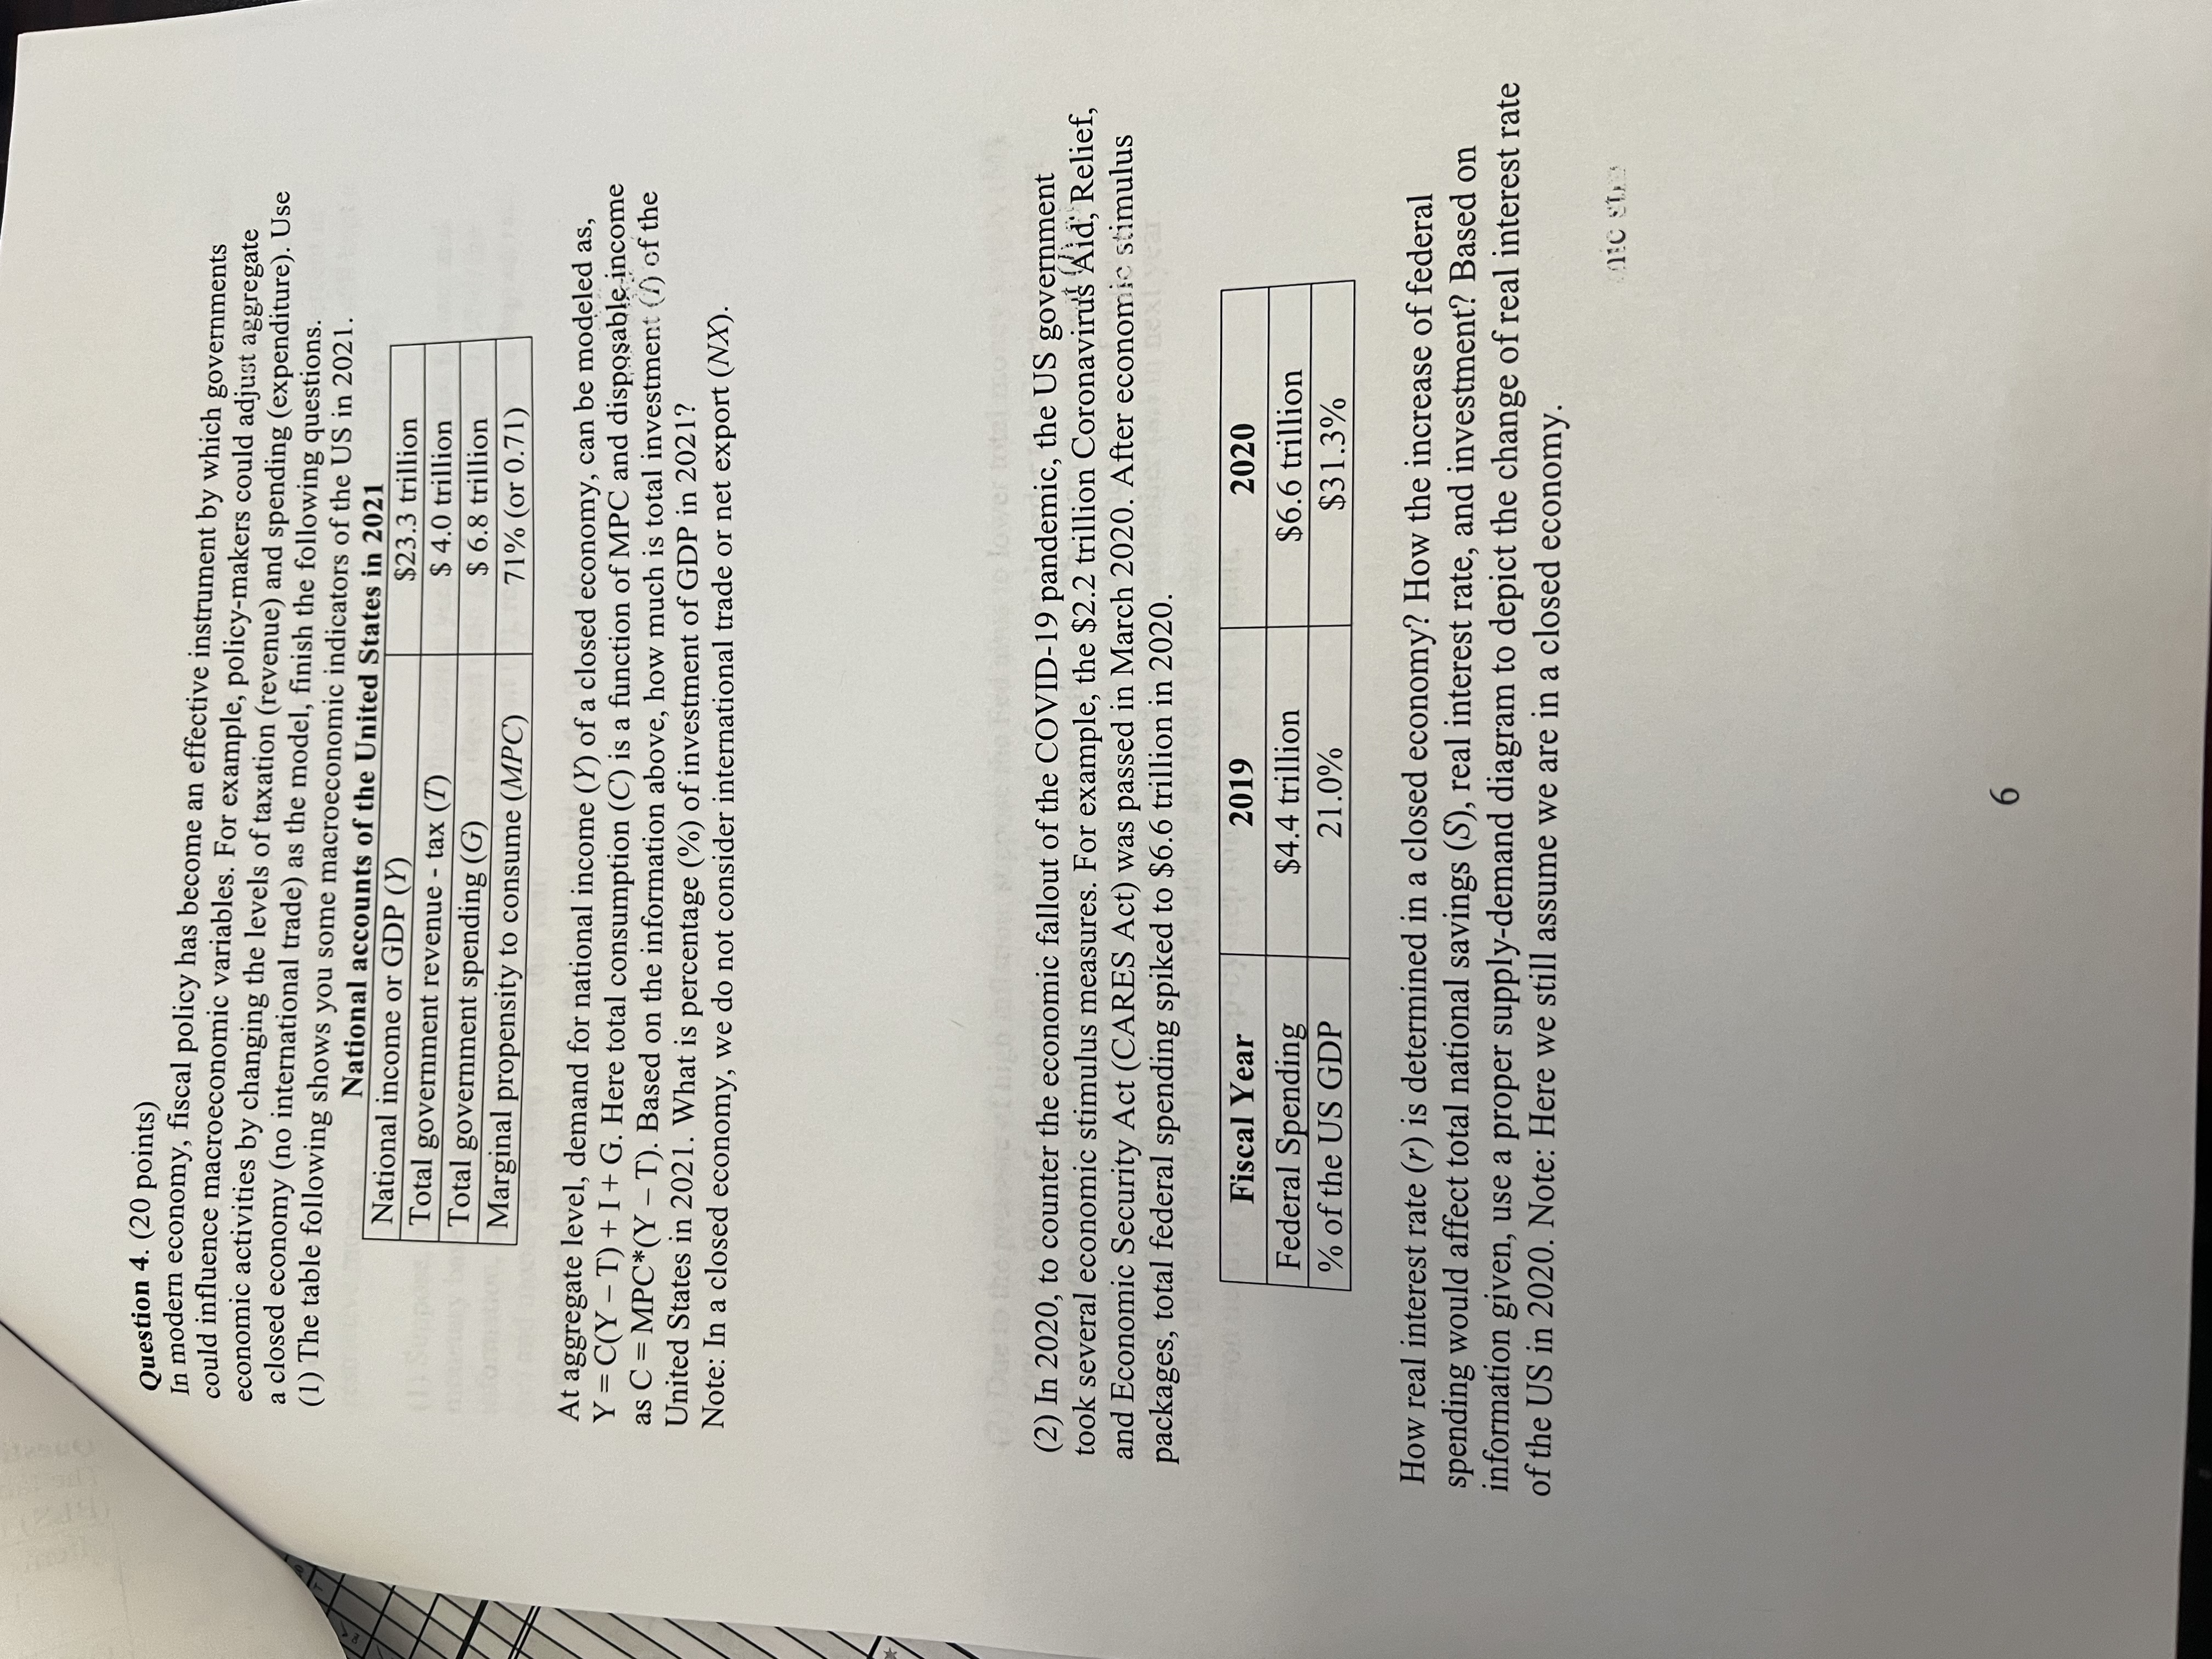
(1) The Bureau of Economic Analysis (BEA) replaced gross national product (GNP) with gross domestic product (GDP) as an update to the National Income and Product Accounts (NIPAS) in November 1991. In concept, both GDP and GNP measure the market value of all final goods and services produced in a certain period. However, there are still differences between them. Explain in your own words how you can get the GNP of a country with adjustments to its GDP. Suppose Honda, as a Japanese vehicle manufacturer, made 8 billion dollars ($) in the United States in 2023. How the $8 billion affects US GDP and GNP? How it affects Japanese GDP and GNP? (2) The Consumer Price Index (CPI) is a series of price indices calculated by the U.S. Bureau of Labor Statistics (BLS) per month. Suppose we know the average CPI was 259 in December 2019. After years, the average CPI jumped up to 309 in December 2023. Suppose a gallon gasoline costs $2.55 in December 2019. Then, how much is the cost ($/gallon) equivalent to the dollar value in December 2023. Question 2. (20 points) As a new field, the demand for data engineers has been increasing in the United States. A study of the Bureau of Labor Statistics (BLS) shows the job outlook for data engineers (scientists) is very promising. There will be 35% increase of the demand for data engineers from 2022 to 2032, which is a lot faster than average. As in all business, one critical factor determining the supply of data engineers is how much they can get paid. Suppose the supply of data engineers (Q) is a function of hourly wage (W). That is Q = c + d* W; where c> 0 and d > 0. The unit of Q is the number of jobs in a year and W is dollar per hour ($/hour). Jobs of data engineers and hourly wages Wage (P) $37.5 / hour Jobs (Q) $40.0 /hour $42.5/hour $45.0 / hour 165,000 170,000 Wage (P) $45.5 / hour $47.5/hour $50.0 / hour $52.5 / hour Jobs (Q) use the numbers given to derive the function. Note: Supply function is a linear relation of Q to W. You do not need worry about the units. Just Di (1) With the information in the table as above, what is the supply function of data engineers in Finish the supply table given above. the US? Q = c + d* W; where c> 0 and d > 0. Here you need to get the parameters of c and d. the inf (2) Now suppose with applications of artificial intelligence (AI), it is getting more efficient to train data scientists. After a new AI model introduced in 2023, given a stable demand for data engineers, what will be the consequence of this change to the market of data engineers? You may present an intuitive (statement) or a graphical (using diagrams) answer. You need to explain which curve (demand or supply) is affected, to which direction (right or left), and how the new equilibrium looks like compared with the original equilibrium. 4 SP TO (B12) Question 4. (20 points) In modern economy, fiscal policy has become an effective instrument by which governments could influence macroeconomic variables. For example, policy-makers could adjust aggregate economic activities by changing the levels of taxation (revenue) and spending (expenditure). Use a closed economy (no international trade) as the model, finish the following questions. (1) The table following shows you some macroeconomic indicators of the US in 2021. National accounts of the United States in 2021 DM National income or GDP (Y) Total government revenue - tax (T) Total government spending (G) Marginal propensity to consume (MPC) $23.3 trillion $ 4.0 trillion $ 6.8 trillion 71% (or 0.71) At aggregate level, demand for national income (Y) of a closed economy, can be modeled as, Y = C(YT)+I+ G. Here total consumption (C) is a function of MPC and disposable income as C = MPC*(Y - T). Based on the information above, how much is total investment () of the United States in 2021. What is percentage (%) of investment of GDP in 2021? Note: In a closed economy, we do not consider international trade or net export (NX). (2) In 2020, to counter the economic fallout of the COVID-19 pandemic, the US government took several economic stimulus measures. For example, the $2.2 trillion Coronavirus Aid, Relief, and Economic Security Act (CARES Act) was passed in March 2020. After economic stimulus packages, total federal spending spiked to $6.6 trillion in 2020. in next year Fiscal Year Federal Spending % of the US GDP 2019 $4.4 trillion 21.0% 2020 $6.6 trillion $31.3% How real interest rate (r) is determined in a closed economy? How the increase of federal spending would affect total national savings (S), real interest rate, and investment? Based on information given, use a proper supply-demand diagram to depict the change of real interest rate of the US in 2020. Note: Here we still assume we are in a closed economy. 6 MEC SD E Loo estion 5. (20 points) As a response to inflation, in March 2022, the Federal Reserve approved its first interest rate hike since December 2018. However, inflation still remained very high and piked in June 2022. The the more restrictive monetary policy and approved another interest rate hikes of 0.75 percent in last time inflation ran that high was in the 1980s. To bring down inflation, the Fed implemented November 2022. Even a bank crisis occurred in the first quarter (Q1) of 2023, the Fed still kept a restrictive monetary policy with the target federal funds rate at a range of 4.75% to 5%. (1) Suppose, we know total money supply (M) in the current year equals $24,000 billion, and monetary base (B) is $6,000 billion. The currency deposit ratio (cr) is 0.2 (or 20%). With the information, calculate the values of currency (C), deposit (D), reserves (R), reserve deposit ratio (rr) and money multiplier (m) in this year? Note: you need to show your step-by-step solutions for full credit. (2) Due to the pressure of high inflation, suppose the Fed aims to lower total money supply (M) by 10% (or as 90% of the current level) by the end of next year. In order to achieve this target, the Fed decides to double the current reserve deposit ratio (rr). The currency deposit ratio (cr) remains at the same level of 0.2. Given the new M and rr, calculate the values of currency (C), deposit (D), reserves (R), reserve deposit ratio (rr) and money multiplier (m) in next year. Note: the current (original) values of M and rr are from (1) as above. Note: you need to show your step-by-step solutions for full credit. 7 this is
Step by Step Solution
There are 3 Steps involved in it
Step: 1

Get Instant Access to Expert-Tailored Solutions
See step-by-step solutions with expert insights and AI powered tools for academic success
Step: 2

Step: 3

Ace Your Homework with AI
Get the answers you need in no time with our AI-driven, step-by-step assistance
Get Started


