1
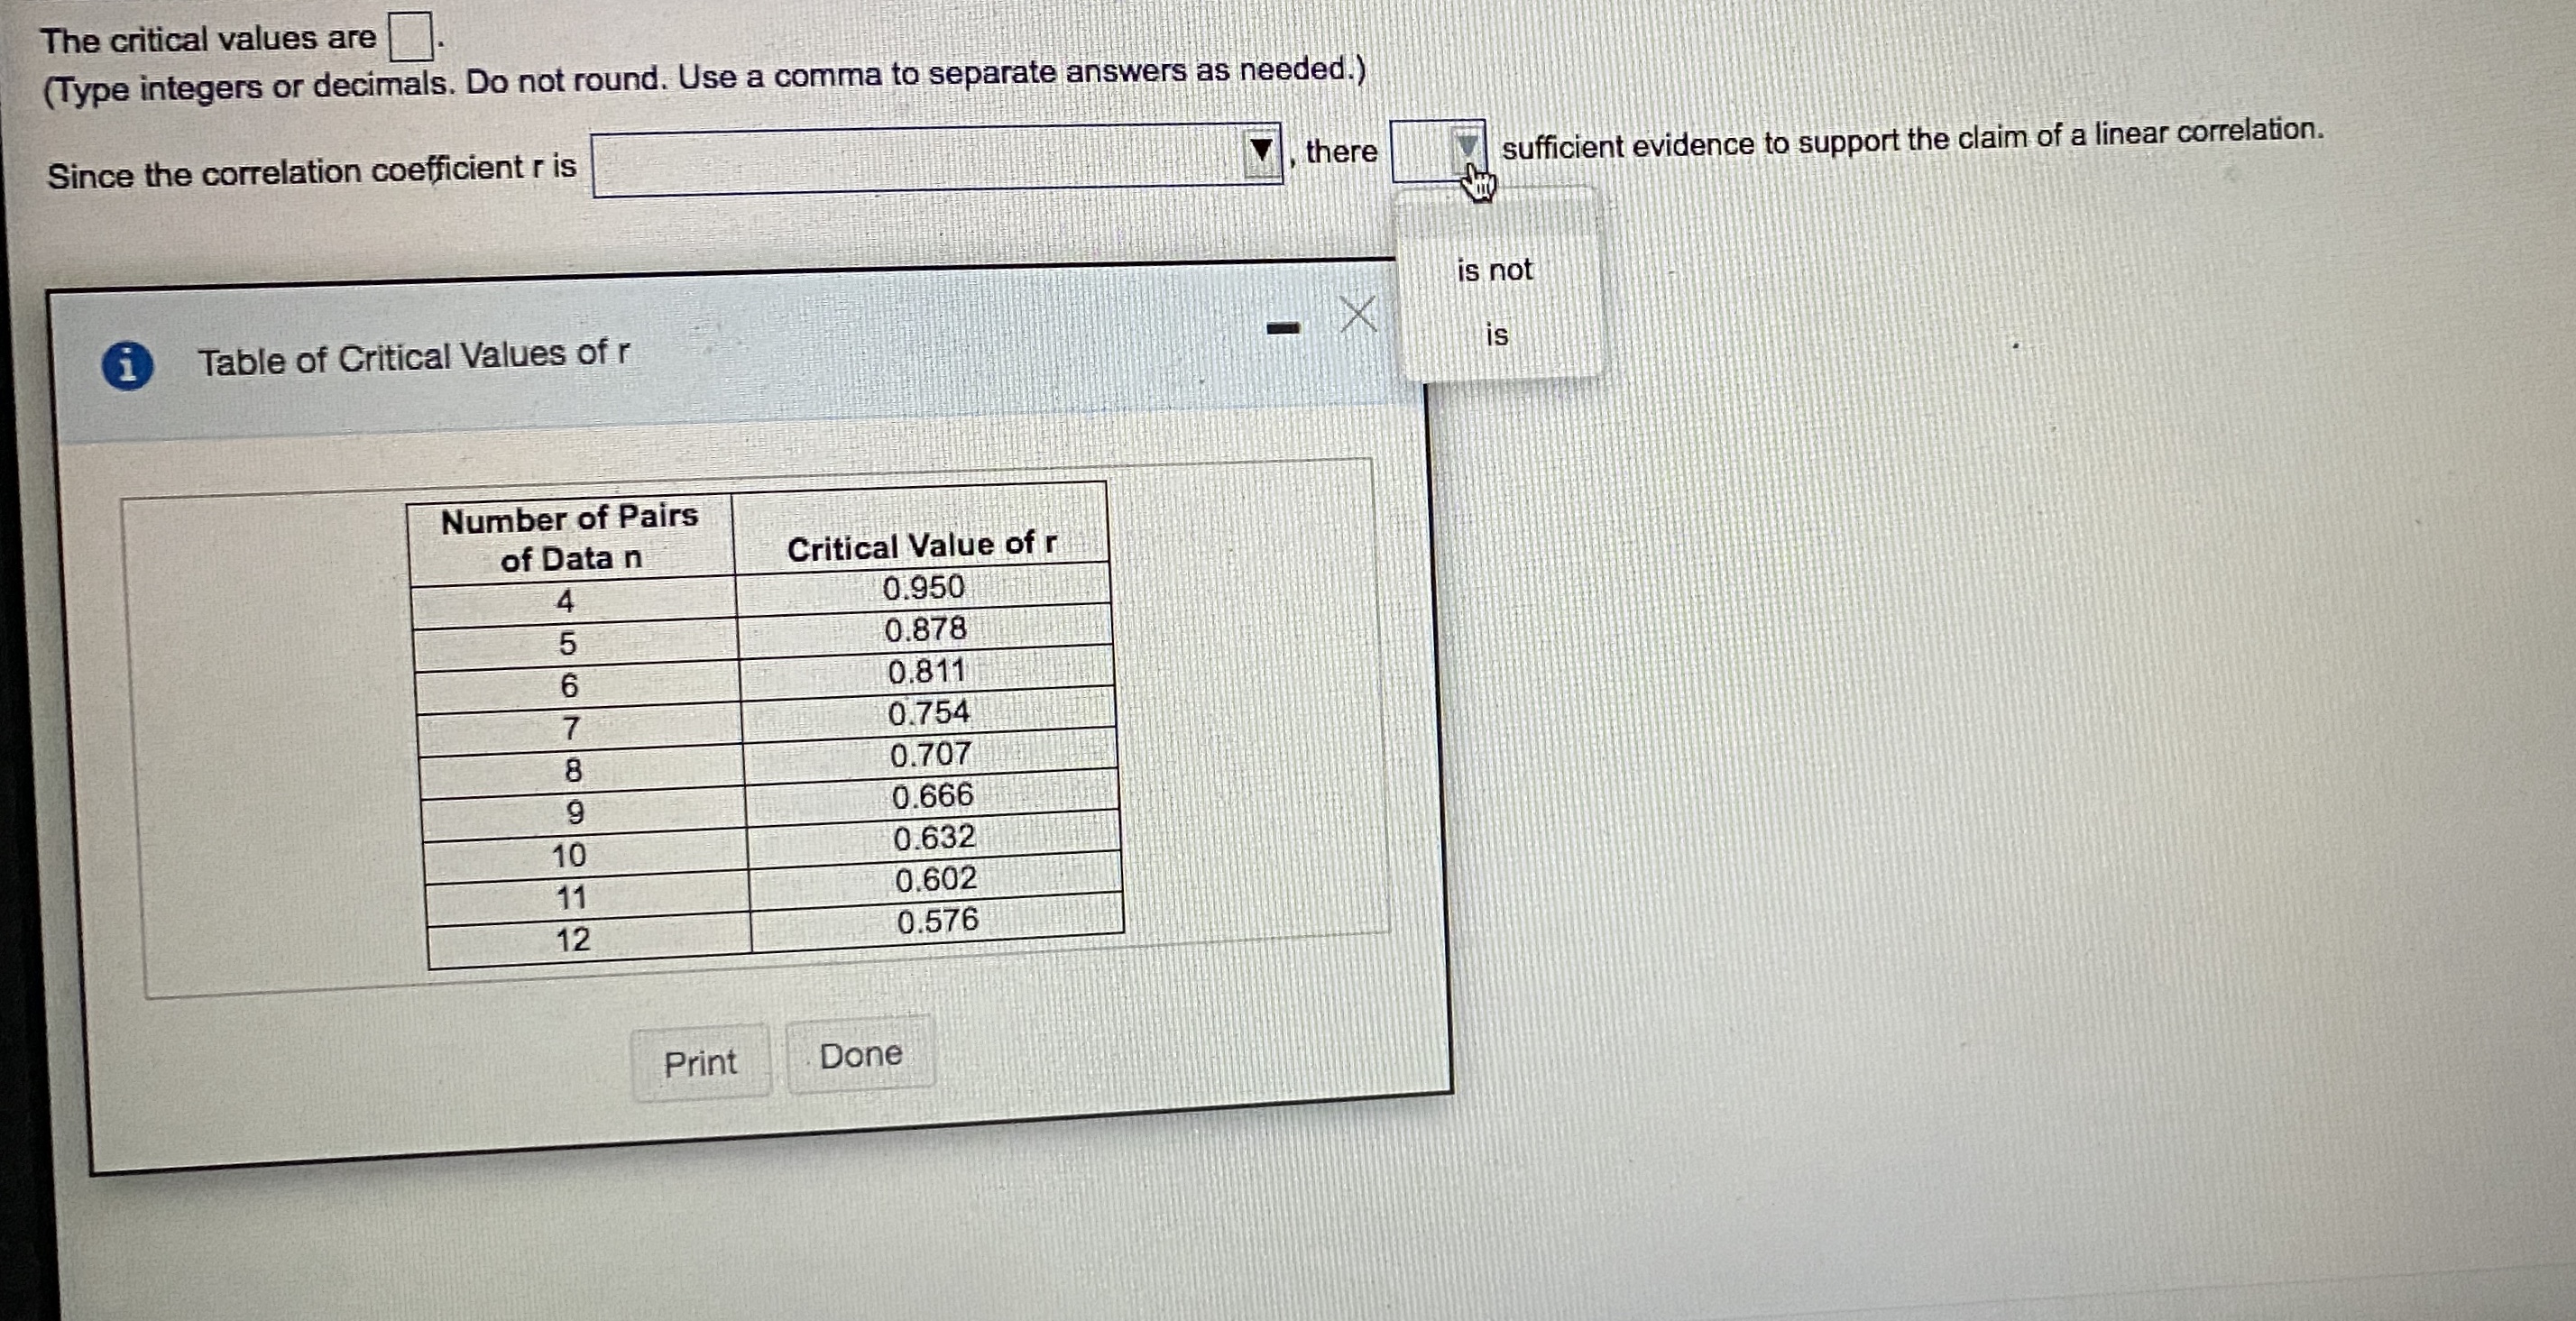
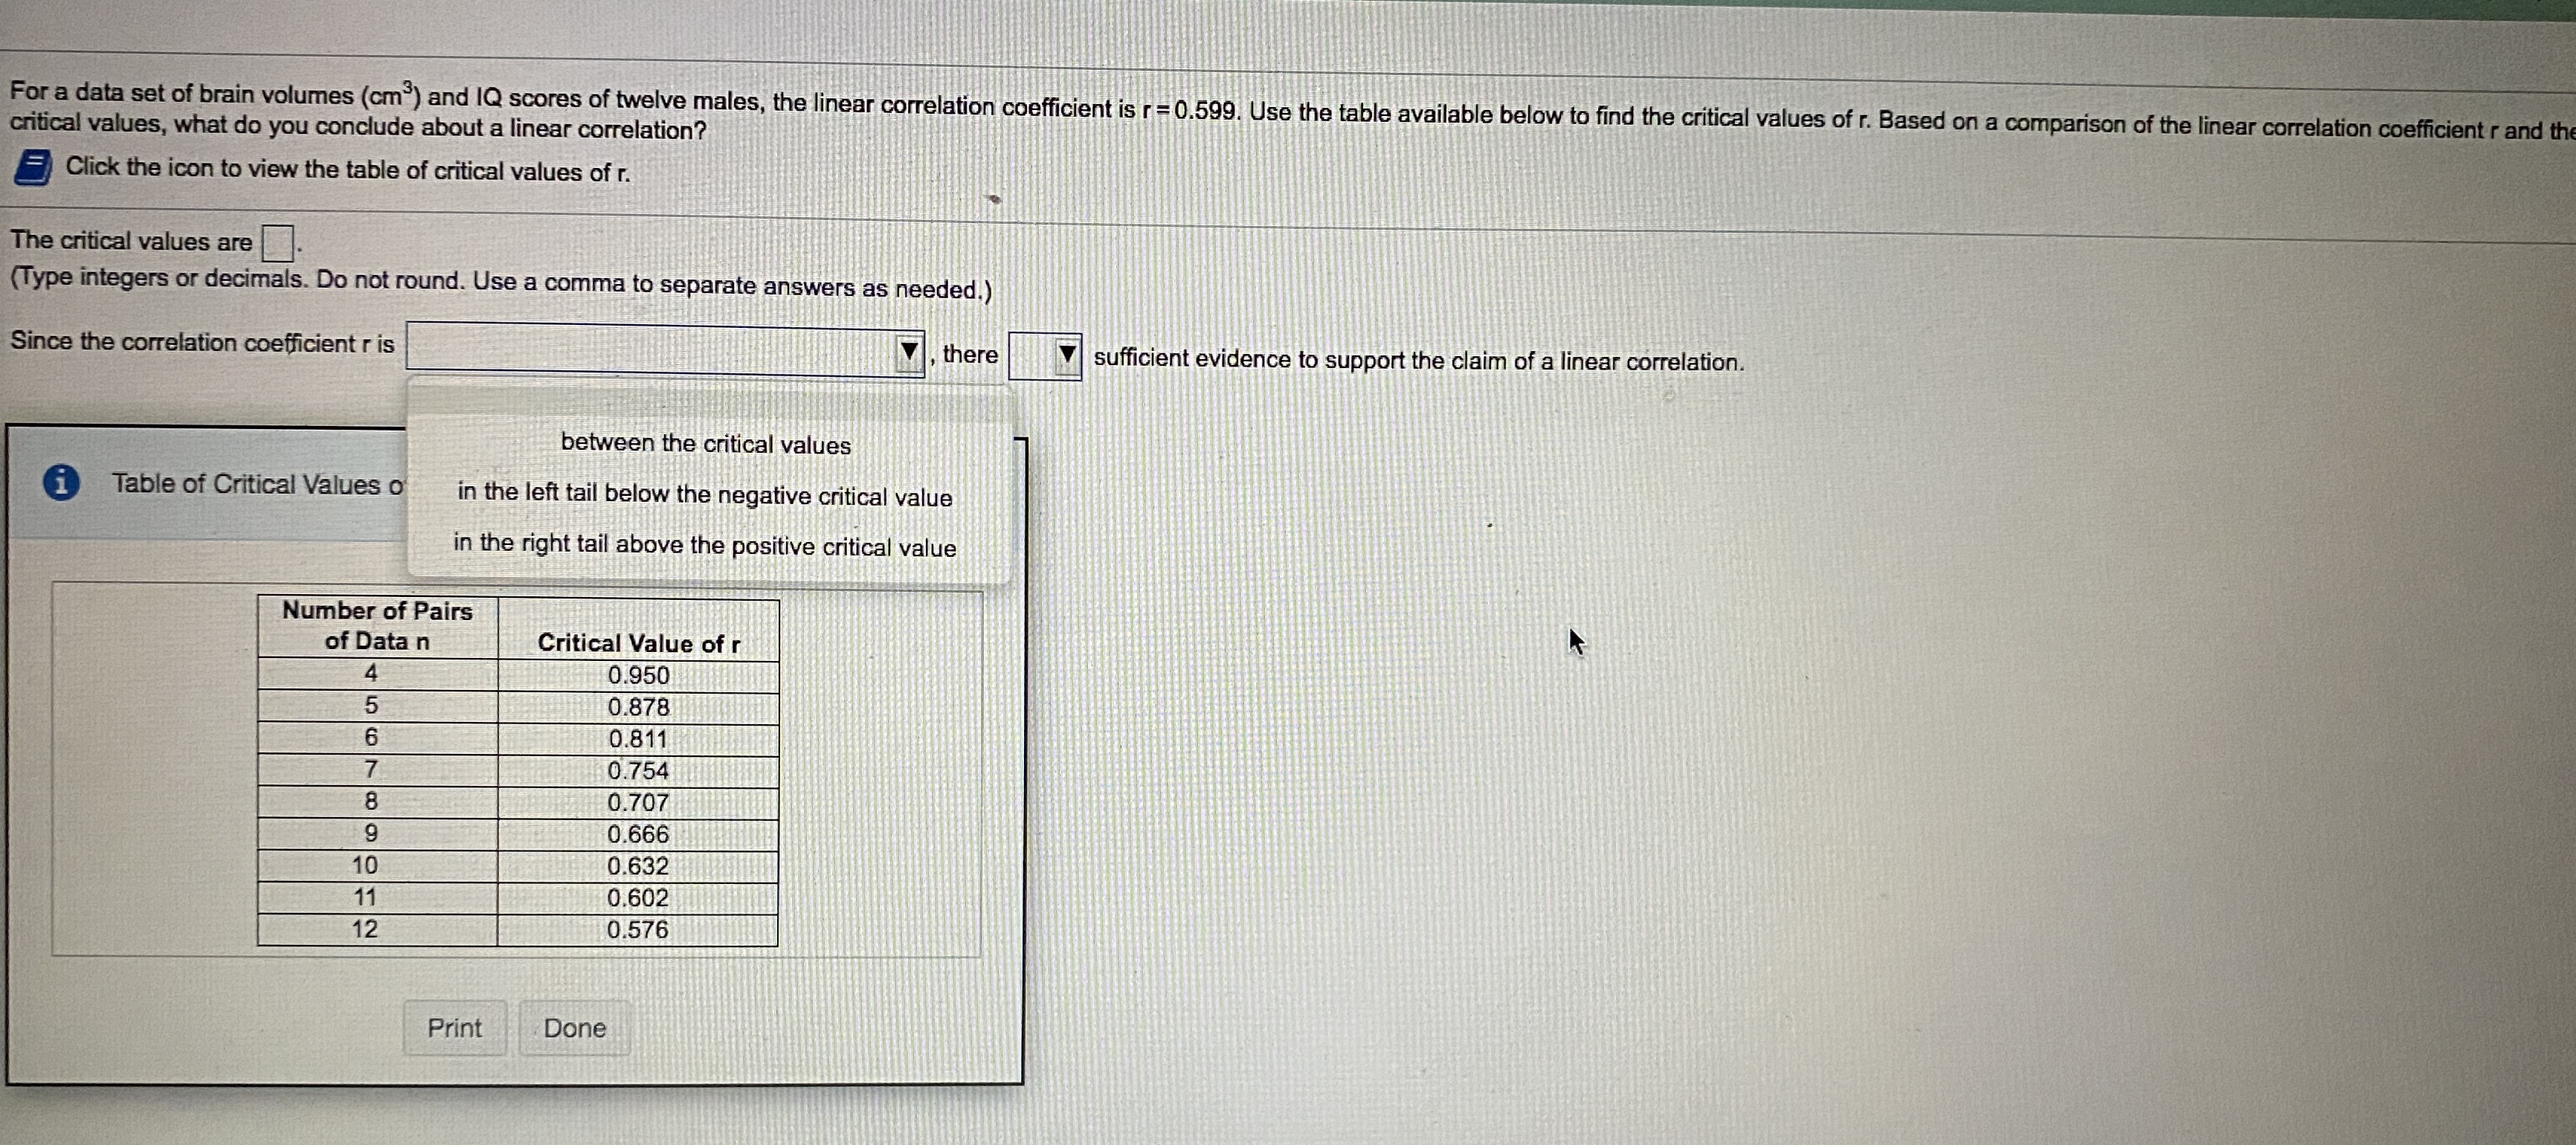
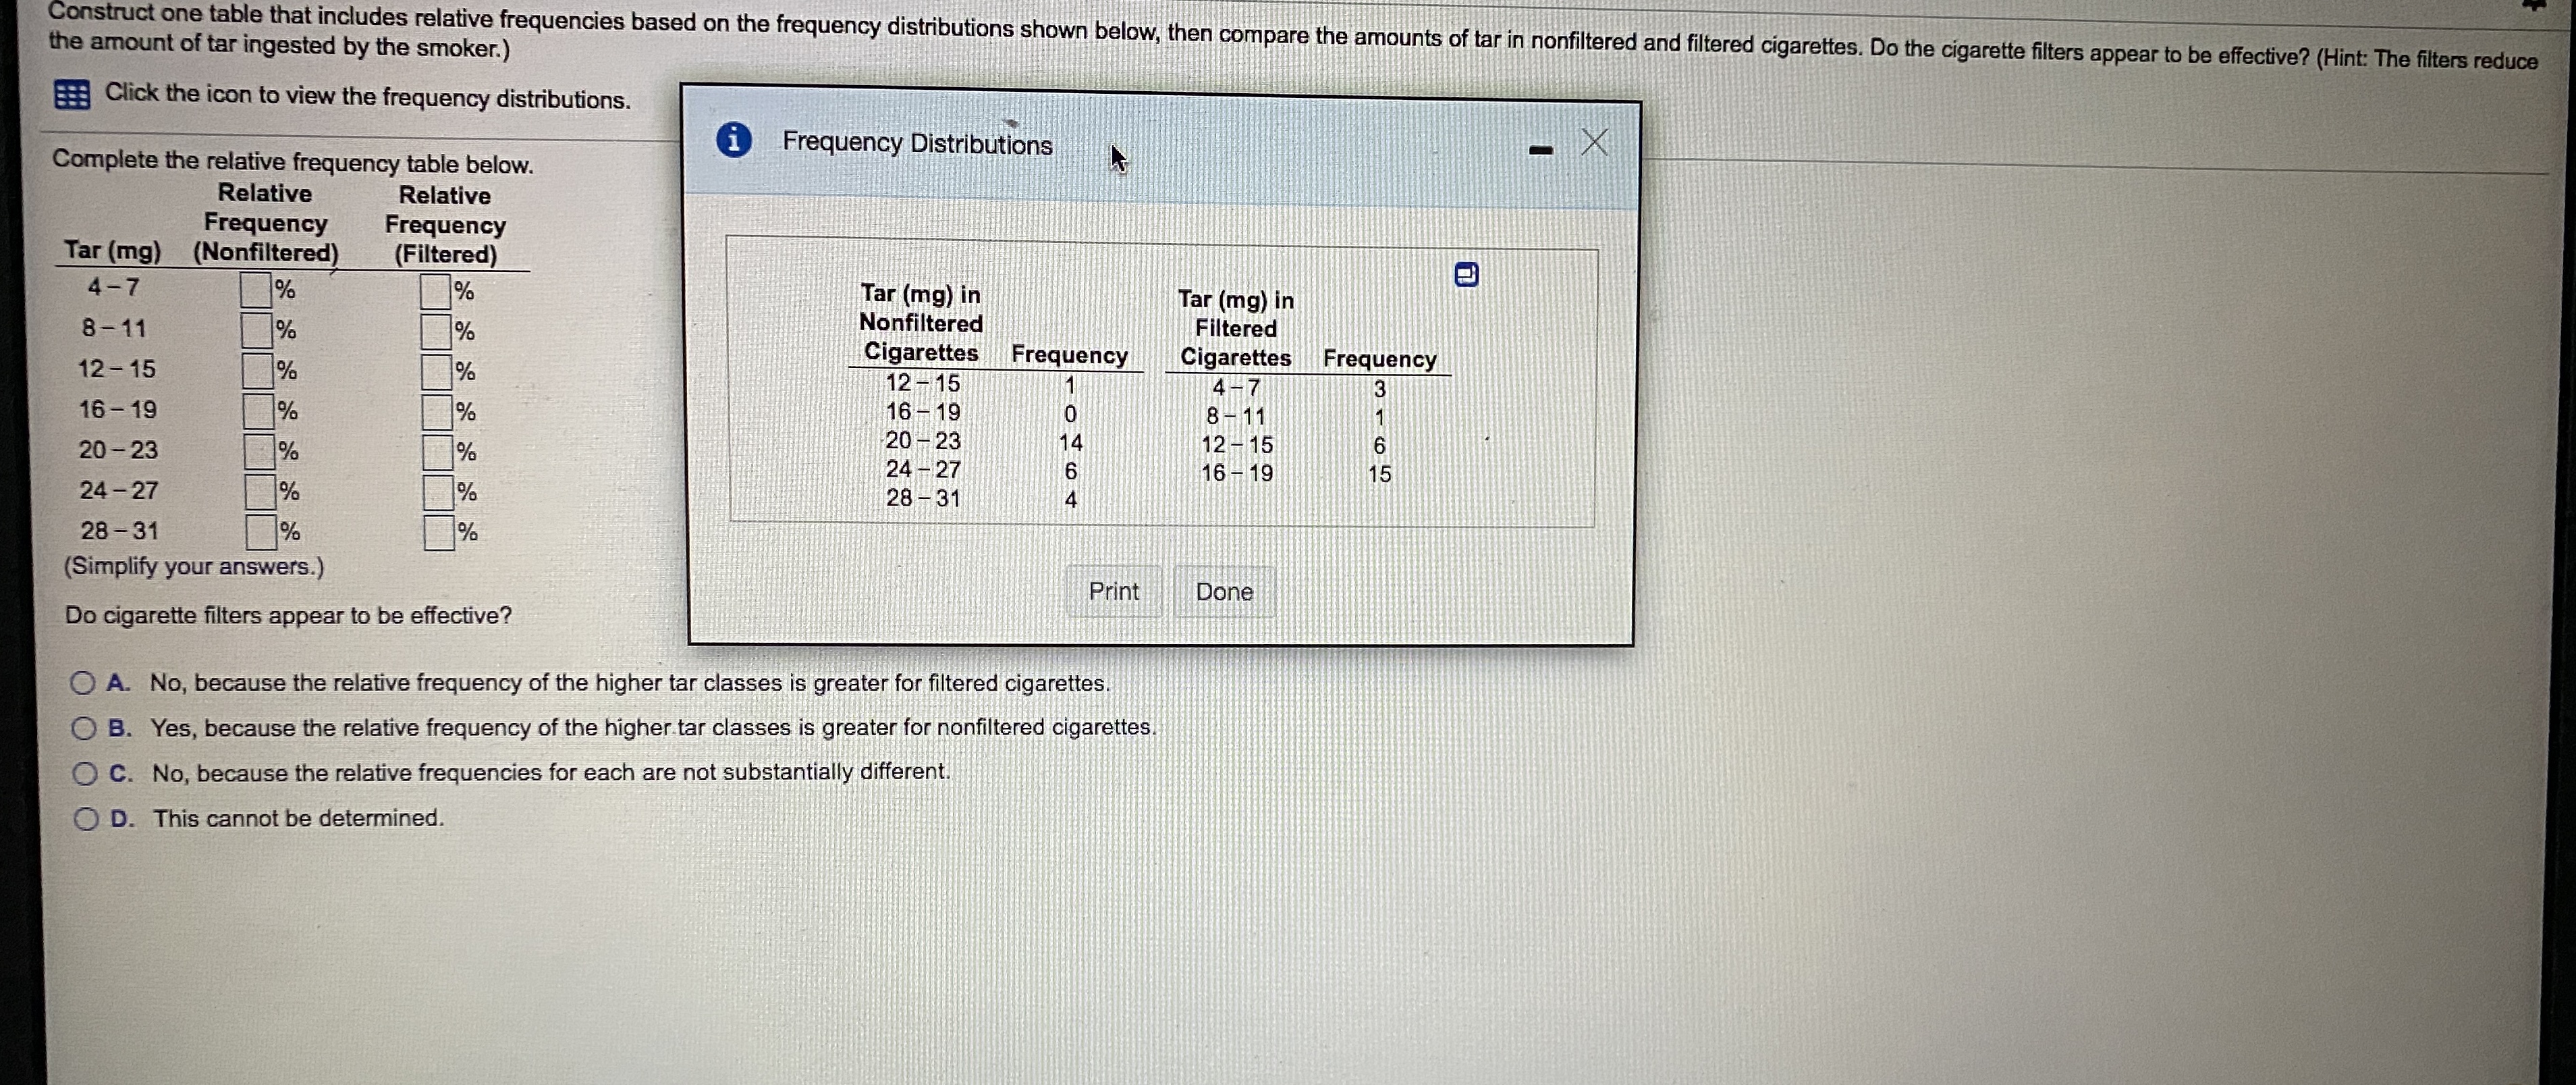
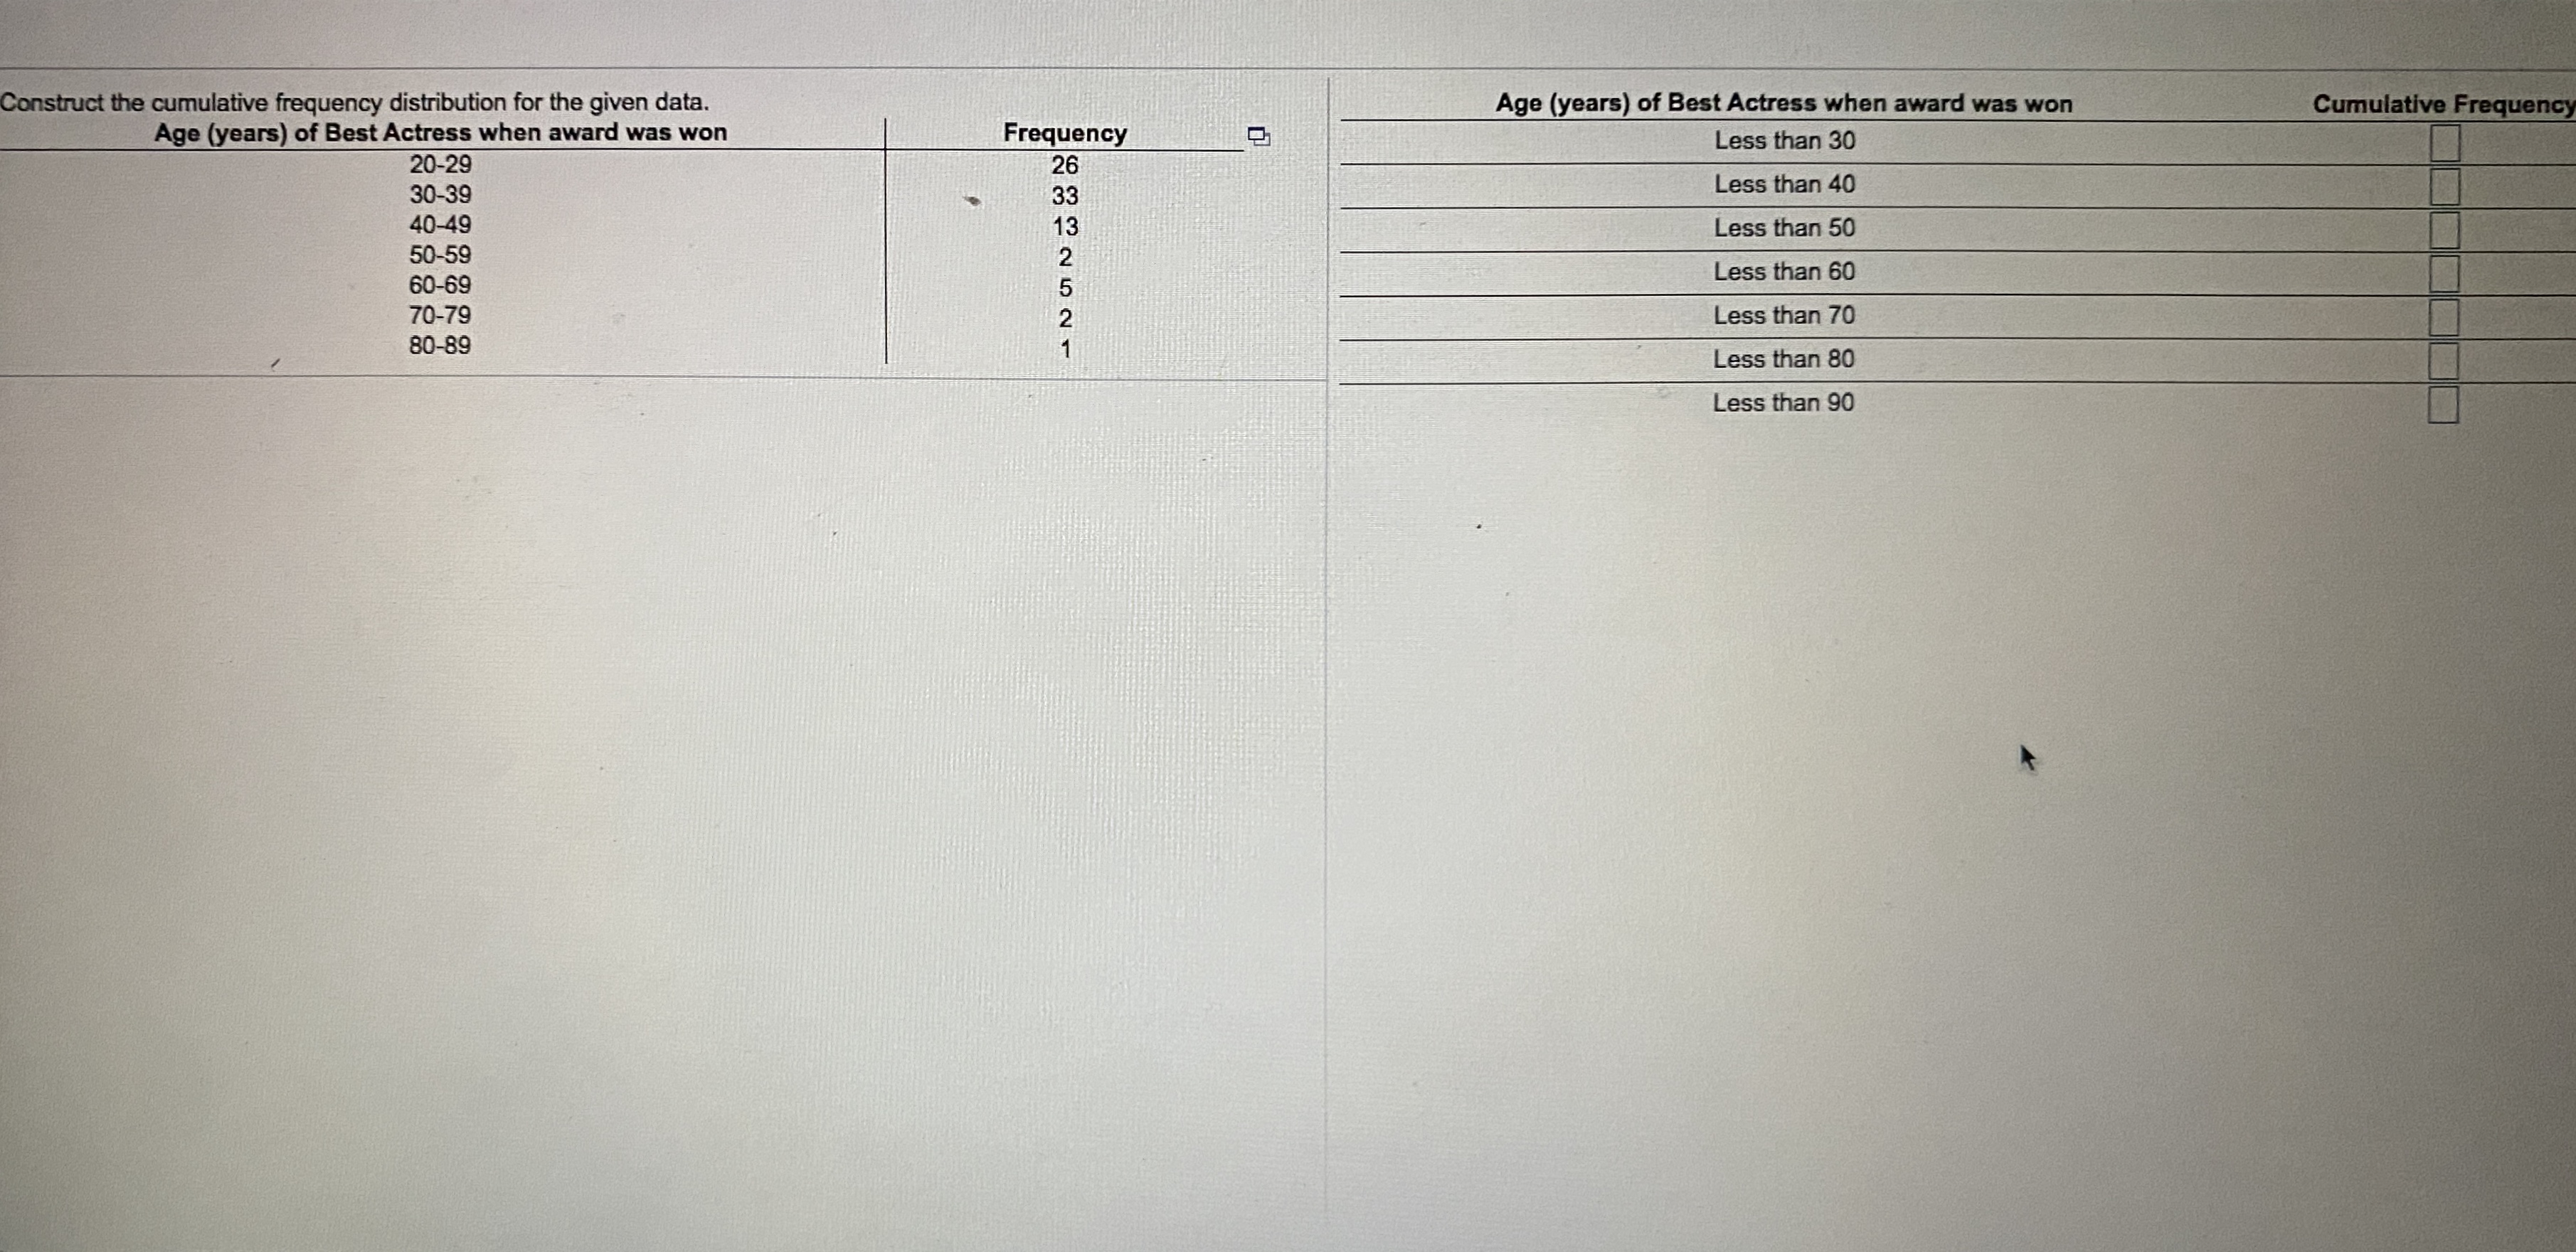
The critical values are (Type integers or decimals. Do not round. Use a comma to separate answers as needed.) Since the correlation coefficient r is there sufficient evidence to support the claim of a linear correlation. is not i Table of Critical Values of r is Number of Pairs of Data n Critical Value of r 4 0.950 5 0.878 6 0.811 7 0.754 8 0.707 9 0.666 10 0.632 11 0.602 12 0.576 Print DoneFor a data set of brain volumes (cm ) and IQ scores of twelve males, the linear correlation coefficient is r = 0.599. Use the table available below to find the critical values of r. Based on a comparison of the linear correlation coefficient r and th critical values, what do you conclude about a linear correlation? Click the icon to view the table of critical values of r. The critical values are. (Type integers or decimals. Do not round. Use a comma to separate answers as needed.) Since the correlation coefficient r is there sufficient evidence to support the claim of a linear correlation. between the critical values i Table of Critical Values o in the left tail below the negative critical value in the right tail above the positive critical value Number of Pairs of Data n Critical Value of r 0.950 0.878 6 0.811 7 0.754 8 0.707 9 0.666 10 0.632 11 0.602 12 0.576 Print DoneConstruct one table that includes relative frequencies based on the frequency distributions shown below, then compare the amounts of tar in nonfiltered and filtered cigarettes. Do the cigarette filters appear to be effective? (Hint: The filters reduce the amount of tar ingested by the smoker.) Click the icon to view the frequency distributions. Complete the relative frequency table below. Frequency Distributions X Relative Relative Frequency Frequency Tar (mg) (Nonfiltered) (Filtered) 4-7 % Tar (mg) in Tar (mg) in 8- 11 1% % Nonfiltered Filtered Cigarettes Frequency Cigarettes Frequency 12-15 1% 12 -15 4 - 7 16 - 19 3 16- 19 8- 11 20-23 1% % 20 - 23 24-27 AODO 12 - 15 6 24 - 27 16 - 19 % 28 -31 28 -31 1% (Simplify your answers.) Print Done Do cigarette filters appear to be effective? O A. No, because the relative frequency of the higher tar classes is greater for filtered cigarettes. O B. Yes, because the relative frequency of the higher tar classes is greater for nonfiltered cigarettes. O C. No, because the relative frequencies for each are not substantially different. O D. This cannot be determined.Construct the cumulative frequency distribution for the given data. Age (years) of Best Actress when award was won Cumulative Frequency Age (years) of Best Actress when award was won Frequency Less than 30 20-29 26 30-39 Less than 40 40-49 Less than 50 50-59 60-69 Less than 60 70-79 Less than 70 80-89 Less than 80 Less than 90