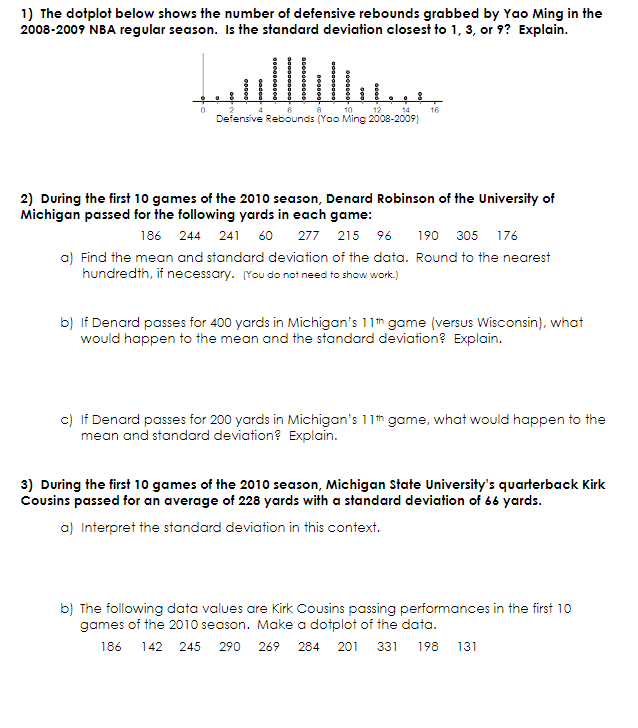
1) The dotplot below shows the number of defensive rebounds grabbed by Yao Ming in the 2008-2009 NBA regular season. Is the standard deviation closest
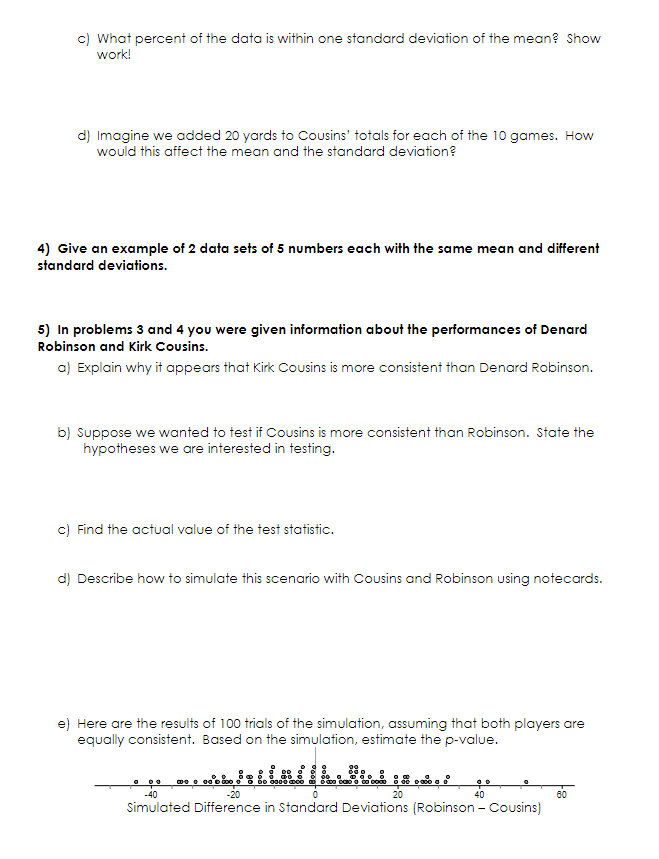
1) The dotplot below shows the number of defensive rebounds grabbed by Yao Ming in the 2008-2009 NBA regular season. Is the standard deviation closest to 1, 3, or 9? Explain. Defensive Rebounds (Yao Ming 2008-2009] 2) During the first 10 games of the 2010 season, Denard Robinson of the University of Michigan passed for the following yards in each game: 186 244 241 60 277 215 96 190 305 176 a) Find the mean and standard deviation of the data. Round to the nearest hundredth, if necessary. (You do not need to show work.) b) If Denard passes for 400 yards in Michigan's 11th game (versus Wisconsin), what would happen to the mean and the standard deviation? Explain. ") If Denard passes for 200 yards in Michigan's 11th game, what would happen to the mean and standard deviation? Explain. 3) During the first 10 games of the 2010 season, Michigan State University's quarterback Kirk Cousins passed for an average of 228 yards with a standard deviation of 66 yards. a) Interpret the standard deviation in this context. b) The following data values are Kirk Cousins passing performances in the first 10 games of the 2010 season. Make a dotplot of the data. 186 142 245 290 269 284 201 331 198 131c) What percent of the data is within one standard deviation of the mean? show work! dj Imagine we added 20 yards to Cousins' totals for each of the 10 games. How would this affect the mean and the standard deviation? 4) Give an example of 2 data sets of 5 numbers each with the same mean and different standard deviations. 5) In problems 3 and 4 you were given information about the performances of Denard Robinson and Kirk Cousins. a) Explain why it appears that Kirk Cousins is more consistent than Denard Robinson. b) Suppose we wanted to test if Cousins is more consistent than Robinson. State the hypotheses we are interested in testing. c) Find the actual value of the test statistic. d) Describe how to simulate this scenario with Cousins and Robinson using notecards. e) Here are the results of 100 trials of the simulation, assuming that both players are equally consistent. Based on the simulation, estimate the p-value. -40 -20 20 40 80 Simulated Difference in Standard Deviations (Robinson - Cousins)t} Interpret the p-value. g] Based on vour tau-value, make an appropriate conclusion. st If one set at data is more consistent than another set at data, its standard deviation is Questions in" -12 ask vou to think about how adding a data value could affect the moan and standard deviation. Remember, when thinking about t'Iov-r it affects tho standard deviation, think about its relative distance from tho moan, since that's what "deviation\" moans. 5'] Adding a value well below the mean will cause the mean to 3] Adding a value well below the mean will cause the standard deviation to s] Adding a value well above the mean will cause the mean to lo] Adding a value well above the mean will cause the standard deviation to ill Adding a value close to the mean will cause the mean to l2] Adding a value close to the mean will cause the standard deviation to ill] Suppose vau add or subtract the same number From each and even, data value. This would cause the mean to and would cause the standard deviation to i4] To find the percentage of data values that are one standard deviation From the r'neonr use and to find the "boundaries". then count how mans.r values are the "boundaries". then divide that number bv 15) Kaitlyn wants to decide whether or not she shoots a basketball better with a basketball made out of synthetic leather or a basketball made out of genuine leather. She wants to design an experiment to help her decide which type of basketball to buy for her upcoming season. She is going to take 20 shots with each type of basketball. a) Why is it important to use randomization? b) What are the explanatory and response variables? c) What are the treatments? d) Can this experiment be run in a blind manner? Explain
Step by Step Solution
There are 3 Steps involved in it
Step: 1
Get Instant Access to Expert-Tailored Solutions
See step-by-step solutions with expert insights and AI powered tools for academic success
Step: 2
Step: 3
Ace Your Homework with AI
Get the answers you need in no time with our AI-driven, step-by-step assistance