

Question
1. The expected return assuming that the past returns represent the expected future returns 2. Calculate the standard deviation of each portfolio 3. Calculate the
1. The expected return assuming that the past returns represent the expected future returns
2. Calculate the standard deviation of each portfolio
3. Calculate the expected return for a portfolio weight 50% in each security
4. Calculate the standard deviation of the portfolio from a combination of the two assets
5. Calculate the minimum variance portfolio for a combination of the two assets
6. Plot the efficient frontier including the minimum variance portfolio
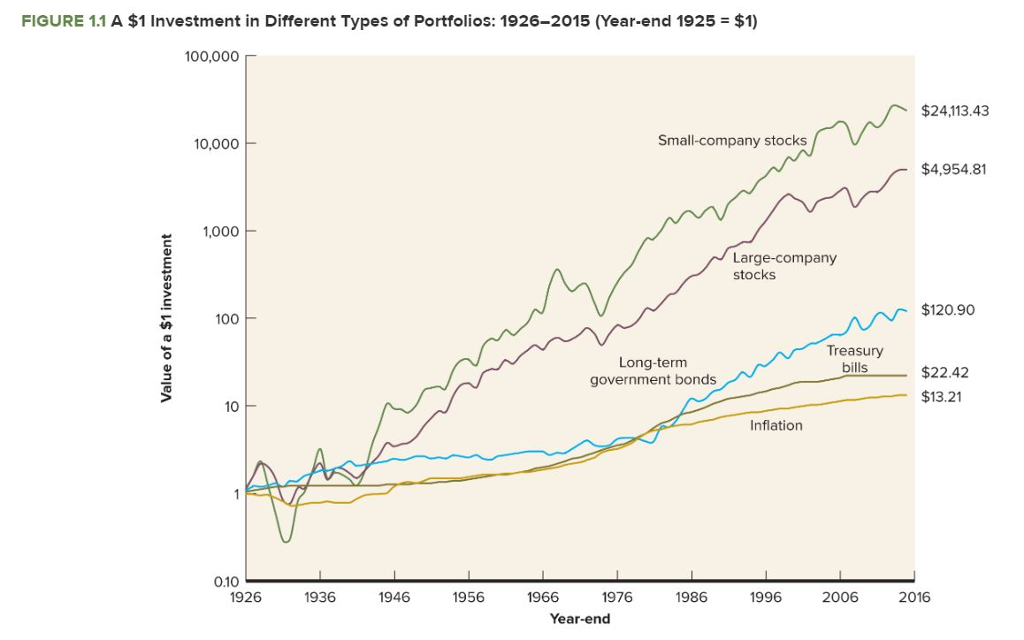
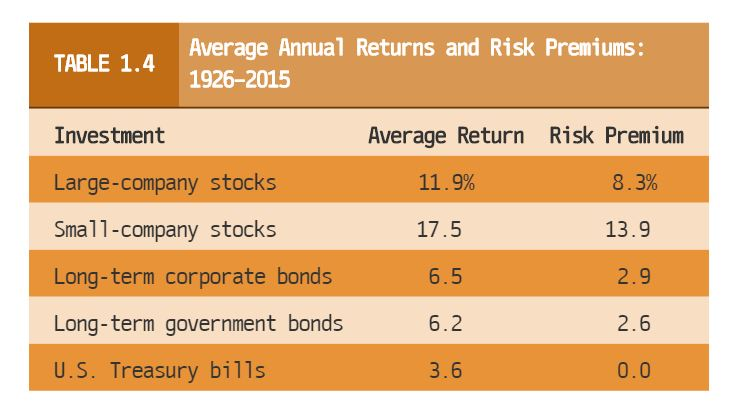
FIGURE 1.1 A $1 Investment in Different Types of Portfolios: 1926-2015 (Year-end 1925 $1) 100,000 $24,113.43 10,000 Small-company stocks $4,954.81 1,000 Large-company stocks $120.90 100 Long-termm government bonds Treasury bills $22.42 $13.21 10 Inflation 0.10 1926 1936 1946 1956 1966 1976 1986 1996 2006 2016 Year-end Average Annual Returns and Risk Premiums: 1926-2015 TABLE 1.4 Average Return Risk Premium Investment Large-company stocks Smal1-company stocks Long-term corporate bonds Long-term government bonds U.S. Treasury bills 11. 9% 17.5 6.5 6.2 3.6 8.3% 13.9 2.9 2.6 0.0Step by Step Solution
There are 3 Steps involved in it
Step: 1

Get Instant Access to Expert-Tailored Solutions
See step-by-step solutions with expert insights and AI powered tools for academic success
Step: 2

Step: 3
Ace Your Homework with AI
Get the answers you need in no time with our AI-driven, step-by-step assistance
Get Started
ISE Financial Markets And Institutions
Authors: Anthony Saunders, Marcia Cornett, Otgo Erhemjamts
8th International Edition
1265561435, 9781265561437