

Question
1. The figure below shows a Px diagram for a binary system at 480 K. Black dots show data points from a series of constant
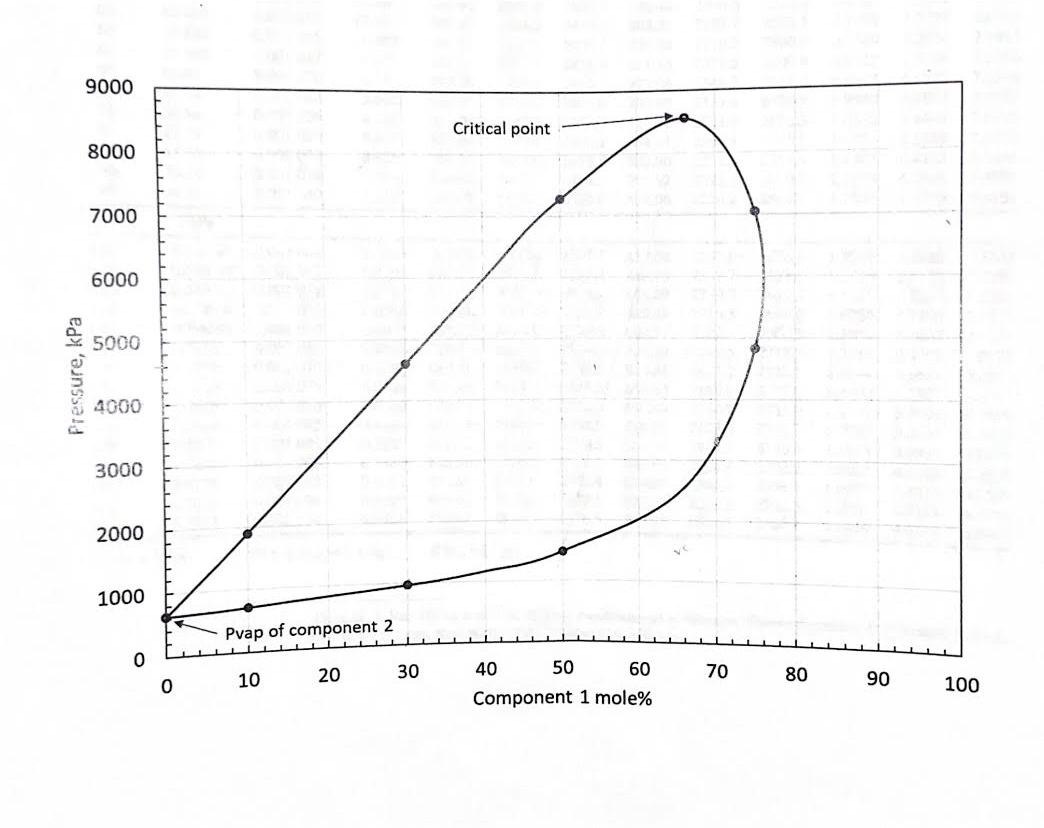
1. The figure below shows a Px diagram for a binary system at 480 K. Black dots show data points from a series of constant mass expansion for several mixtures. Based on this diagram, answer the following:
a) What is the bubble point pressure (kPa) or 30% component 1 and 70% component 2?
b) At the bubble point in Part a, a vapor pressure phase is about to appear. In the figure below, clearly indicate the tie line that connects the liquid phase and the incipient vapor phase at the bubble point. Use a ruler to make your tie line precisely satisfy thermodynamic conditions.
c. Is the critical temperature of component 2 higher than 480 K? Why or why not?
Thank you!!
Step by Step Solution
There are 3 Steps involved in it
Step: 1

Get Instant Access to Expert-Tailored Solutions
See step-by-step solutions with expert insights and AI powered tools for academic success
Step: 2

Step: 3
Ace Your Homework with AI
Get the answers you need in no time with our AI-driven, step-by-step assistance
Get Started
Introduction To Chemical Engineering Thermodynamics
Authors: Hendrick C. Ness, H.C.Van, Van Ness
4th International Edition
0071003037, 978-0071003032