

Question
1. The following boxplots show the total income of 40 randomly chosen households each from Connecticut, Maine, and Massachusetts, based on U.S. Census data
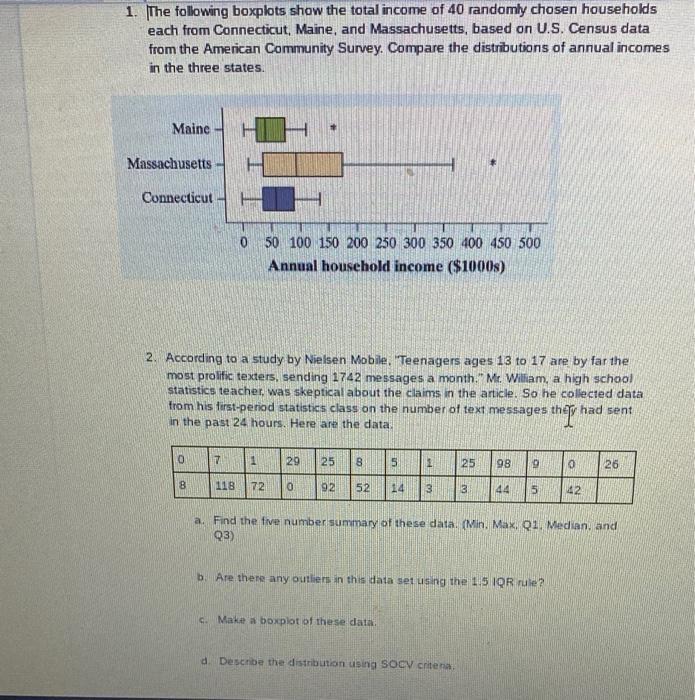
1. The following boxplots show the total income of 40 randomly chosen households each from Connecticut, Maine, and Massachusetts, based on U.S. Census data from the American Community Survey. Compare the distributions of annual incomes in the three states. Maine Massachusetts Connecticut 0 50 100 150 200 250 300 350 400 450 500 Annual household income ($1000s) 2. According to a study by Nielsen Mobile, "Teenagers ages 13 to 17 are by far the most prolific texters, sending 1742 messages a month." Mr. William, a high school statistics teacher, was skeptical about the claims in the article. So he collected data from his first-period statistics class on the number of text messages the in the past 24 hours. Here are the data. they had sent 0 7 1 20 29 25 8 5 2 25 98 0 26 8 118 72 0. 92 52 14 3 3 44 5 42 a. Find the five number summary of these data. (Min. Max. Q1. Median, and (Q3) b. Are there any outliers in this data set using the 1.5 IQR rule? c. Make a boxplot of these data. d. Describe the distribution using SOCV criteria.
Step by Step Solution
There are 3 Steps involved in it
Step: 1

Get Instant Access to Expert-Tailored Solutions
See step-by-step solutions with expert insights and AI powered tools for academic success
Step: 2

Step: 3
Ace Your Homework with AI
Get the answers you need in no time with our AI-driven, step-by-step assistance
Get Started
Principles Of External Auditing
Authors: Brenda Porter, Jon Simon, David Hatherly
1st Edition
0471962120, 978-0471962120