Answered step by step
Verified Expert Solution
Question
1 Approved Answer
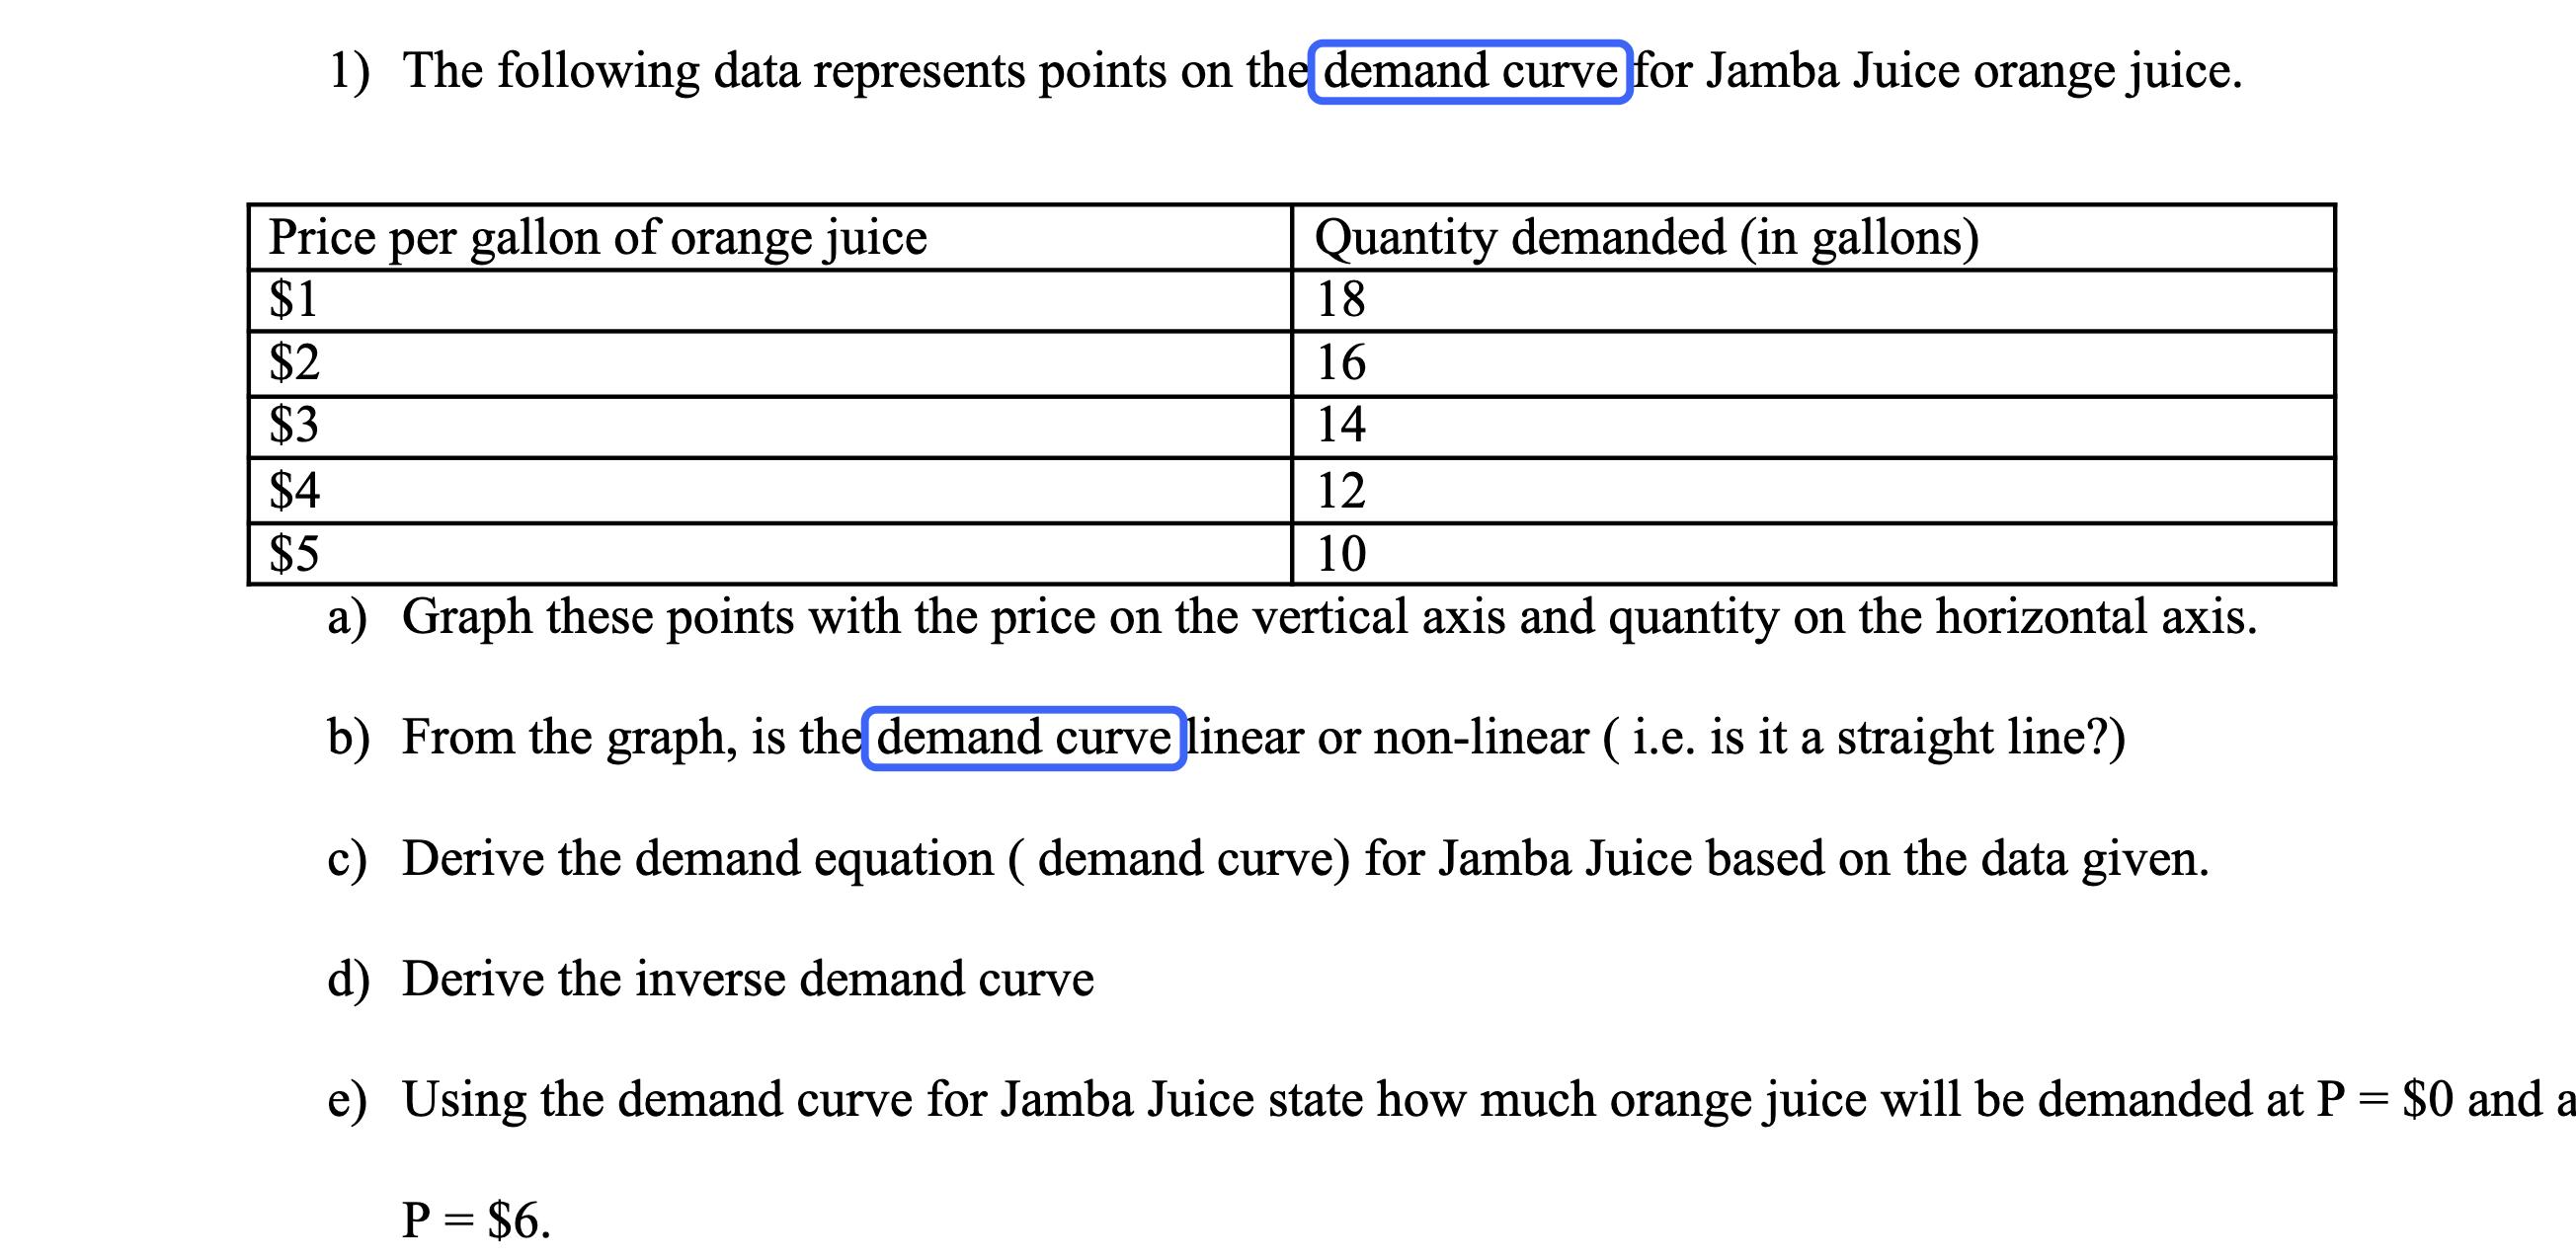
1) The following data represents points on the demand curve for Jamba Juice orange juice. Price per gallon of orange juice $1 $2 $3

1) The following data represents points on the demand curve for Jamba Juice orange juice. Price per gallon of orange juice $1 $2 $3 $4 $5 Quantity demanded (in gallons) 18 16 14 12 10 a) Graph these points with the price on the vertical axis and quantity on the horizontal axis. b) From the graph, is the demand curve linear or non-linear ( i.e. is it a straight line?) c) Derive the demand equation ( demand curve) for Jamba Juice based on the data given. d) Derive the inverse demand curve e) Using the demand curve for Jamba Juice state how much orange juice will be demanded at P = $0 and a P = $6.
Step by Step Solution
★★★★★
3.40 Rating (163 Votes )
There are 3 Steps involved in it
Step: 1
Okay lets work through this stepbystep a Graphing the demand points Quantity Demanded Gallons ...
Get Instant Access to Expert-Tailored Solutions
See step-by-step solutions with expert insights and AI powered tools for academic success
Step: 2

Step: 3

Ace Your Homework with AI
Get the answers you need in no time with our AI-driven, step-by-step assistance
Get Started


