Answered step by step
Verified Expert Solution
Link Copied!

Question

1 Approved Answer

1 . The following data shows the relationship between price and quantity demanded at four different prices for a product: P:$11,Qd=16 P=$9,Qd=24 P=$7,Qd=32 P=$5,Qd=40 Using

image text in transcribed
1 . The following data shows the relationship between price and quantity demanded at four different prices for a product: P:$11,Qd=16 P=$9,Qd=24 P=$7,Qd=32 P=$5,Qd=40 Using the midpoints formula, what is the price elasticity of demand between: (a) $11 and $9; (b) 7 and $5? (show your work)

Step by Step Solution

There are 3 Steps involved in it

Step: 1

blur-text-image

Get Instant Access to Expert-Tailored Solutions

See step-by-step solutions with expert insights and AI powered tools for academic success

Step: 2

blur-text-image

Step: 3

blur-text-image

Ace Your Homework with AI

Get the answers you need in no time with our AI-driven, step-by-step assistance

Get Started

Recommended Textbook for

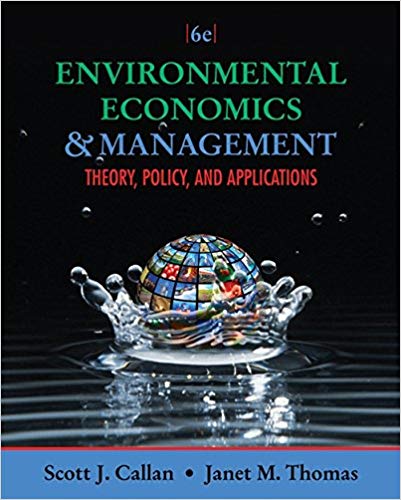
Environmental Economics and Management Theory, Policy and Applications

Authors: Scott J. Callan, Janet M. Thomas

6th edition

1111826673, 1111826676, 1439080634, 1439080631, 9781285528540 , 978-1111826673

More Books

Students also viewed these Economics questions

Question

=+c) Would you use this model? Explain.

Answered: 1 week ago

Question

Context, i.e. the context of the information presented and received

Answered: 1 week ago