

Answered step by step
Verified Expert Solution
Question
1 Approved Answer
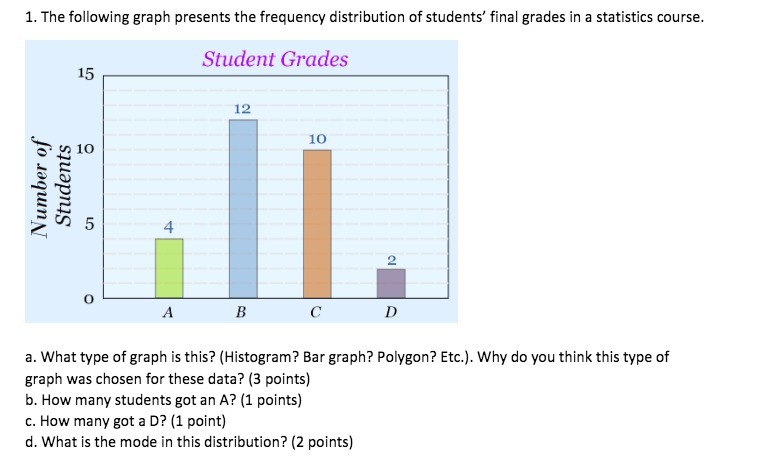
1. The following graph presents the frequency distribution of students' final grades in a statistics course. 15 Student Grades Number of Students In A B
Step by Step Solution
There are 3 Steps involved in it
Step: 1

Get Instant Access to Expert-Tailored Solutions
See step-by-step solutions with expert insights and AI powered tools for academic success
Step: 2

Step: 3
Ace Your Homework with AI
Get the answers you need in no time with our AI-driven, step-by-step assistance
Get Started