

Answered step by step
Verified Expert Solution
Question
1 Approved Answer
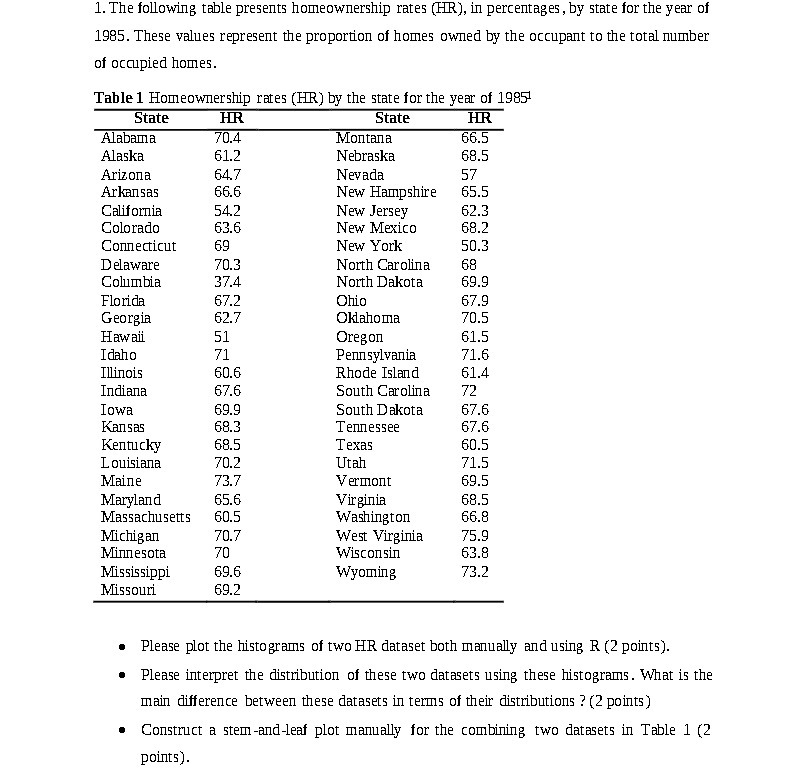
1. The following table presents homeownership rates (HR), in percentages, by state for the year of 1985. These values represent the proportion of homes owned

Step by Step Solution
There are 3 Steps involved in it
Step: 1

Get Instant Access to Expert-Tailored Solutions
See step-by-step solutions with expert insights and AI powered tools for academic success
Step: 2

Step: 3
Ace Your Homework with AI
Get the answers you need in no time with our AI-driven, step-by-step assistance
Get Started
Entropy And Diversity The Axiomatic Approach
Authors: Tom Leinster
1st Edition
1108962173, 9781108962179