Answered step by step
Verified Expert Solution
Link Copied!

Question

1 Approved Answer

1. The following table provides the long-run total cost for three different organizations: Quantity Organization II Organization III 190 320 450 For each organization, explain
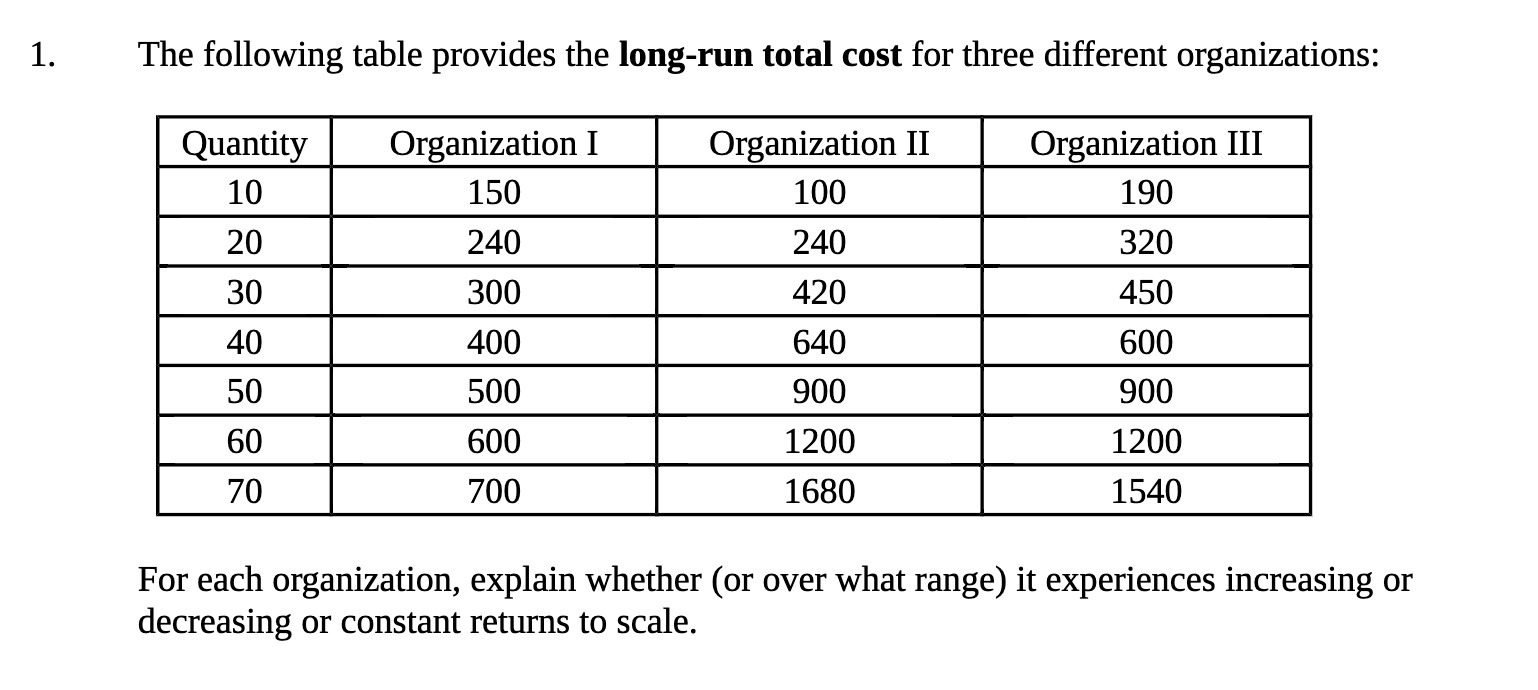
image text in transcribed
1. The following table provides the long-run total cost for three different organizations: Quantity Organization II Organization III 190 320 450 For each organization, explain whether (or over what range) it experiences increasing or decreasing or constant returns to scale

Step by Step Solution

There are 3 Steps involved in it

Step: 1

blur-text-image

Get Instant Access to Expert-Tailored Solutions

See step-by-step solutions with expert insights and AI powered tools for academic success

Step: 2

blur-text-image

Step: 3

blur-text-image

Ace Your Homework with AI

Get the answers you need in no time with our AI-driven, step-by-step assistance

Get Started

Recommended Textbook for

Econometric Analysis

Authors: William H. Greene

5th Edition

130661899, 978-0130661890

More Books

Students also viewed these Economics questions

Question

Which companys ratios match Column E?

Answered: 1 week ago

Question

Which companys ratios match Column H?

Answered: 1 week ago

Question

Which companys ratios match Column D?

Answered: 1 week ago