

Answered step by step
Verified Expert Solution
Question
1 Approved Answer
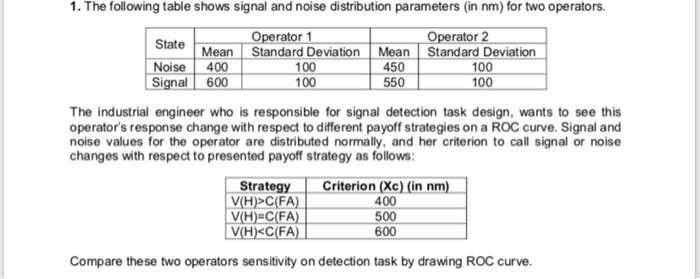
1. The following table shows signal and noise distribution parameters (in nm) for two operators. State Operator 1 Standard Deviation 100 100 Mean 400 600
Step by Step Solution
There are 3 Steps involved in it
Step: 1

Get Instant Access to Expert-Tailored Solutions
See step-by-step solutions with expert insights and AI powered tools for academic success
Step: 2

Step: 3
Ace Your Homework with AI
Get the answers you need in no time with our AI-driven, step-by-step assistance
Get Started
A Textbook Of Accounting For Management
Authors: S.N. Maheshwari
3rd Edition
9325956195, 978-9325956193