Answered step by step
Verified Expert Solution
Question
1 Approved Answer
1. The following table shows the consumption of electricity of 100 householders during a particular week. iv. Consumption (kilowatt hours) 0-under 10 10-under 20


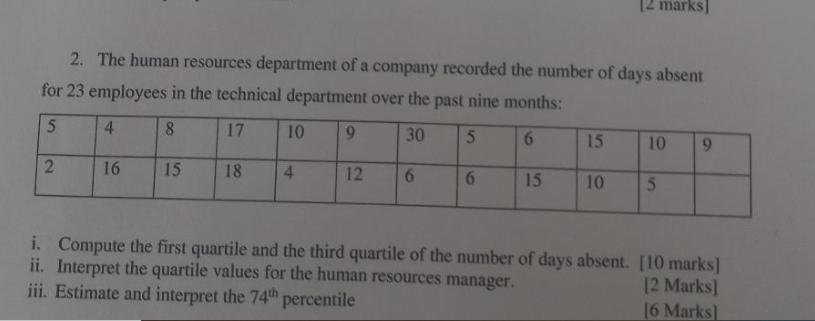
1. The following table shows the consumption of electricity of 100 householders during a particular week. iv. Consumption (kilowatt hours) 0-under 10 10-under 20 20-under 30 30- under 40 40- under 50 50-under 60 60-under 70 70-under 80 80 or over Calculate the: i. ii. iii. Mean electricity consumption Lower quartile Upper quartile Interpret your answers. Number of Households 5 8 20 29 20 11 6 1 0 [5 marks] [5 marks] [5 marks] [2 marks] 2. The human resources department of a company recorded the number of days absent for 23 employees in the technical department over the past nine months: 5 4 8 17 30 5 6 2 16 15 10 18 4 9 12 6 6 15 15 [2 marks] 10 10 9 5 i. Compute the first quartile and the third quartile of the number of days absent. [10 marks] ii. Interpret the quartile values for the human resources manager. [2 marks] [6 Marks] iii. Estimate and interpret the 74th percentile
Step by Step Solution
★★★★★
3.28 Rating (163 Votes )
There are 3 Steps involved in it
Step: 1
1 Consumption 010 1211020 2030 3040 4050 5060 6070 ...
Get Instant Access to Expert-Tailored Solutions
See step-by-step solutions with expert insights and AI powered tools for academic success
Step: 2

Step: 3

Ace Your Homework with AI
Get the answers you need in no time with our AI-driven, step-by-step assistance
Get Started


