

Answered step by step
Verified Expert Solution
Question
1 Approved Answer
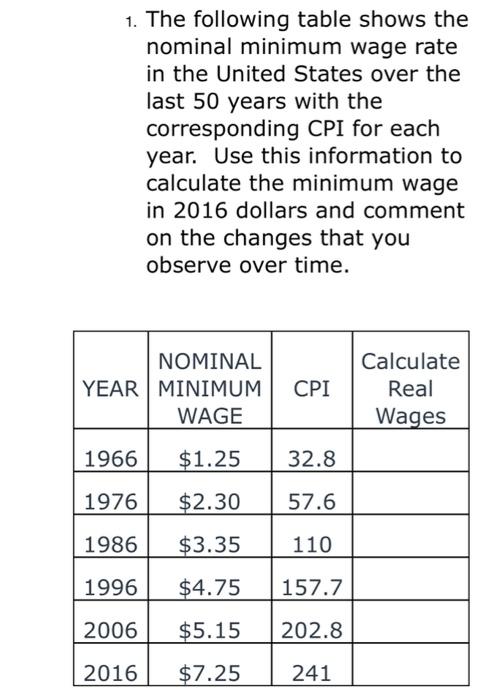
1. The following table shows the nominal minimum wage rate in the United States over the last 50 years with the corresponding CPI for each
Step by Step Solution
There are 3 Steps involved in it
Step: 1

Get Instant Access to Expert-Tailored Solutions
See step-by-step solutions with expert insights and AI powered tools for academic success
Step: 2

Step: 3
Ace Your Homework with AI
Get the answers you need in no time with our AI-driven, step-by-step assistance
Get Started
Medical Record Auditor A Guide To Improving Clinical Documentation In A Changing Health Environment
Authors: Deborah J. Grider
4th Edition
1622021010, 978-1622021017