Question
1. The graph below represents the velocity of an object as a function of time, that's moving in one dimension. Sketch the acceleration as

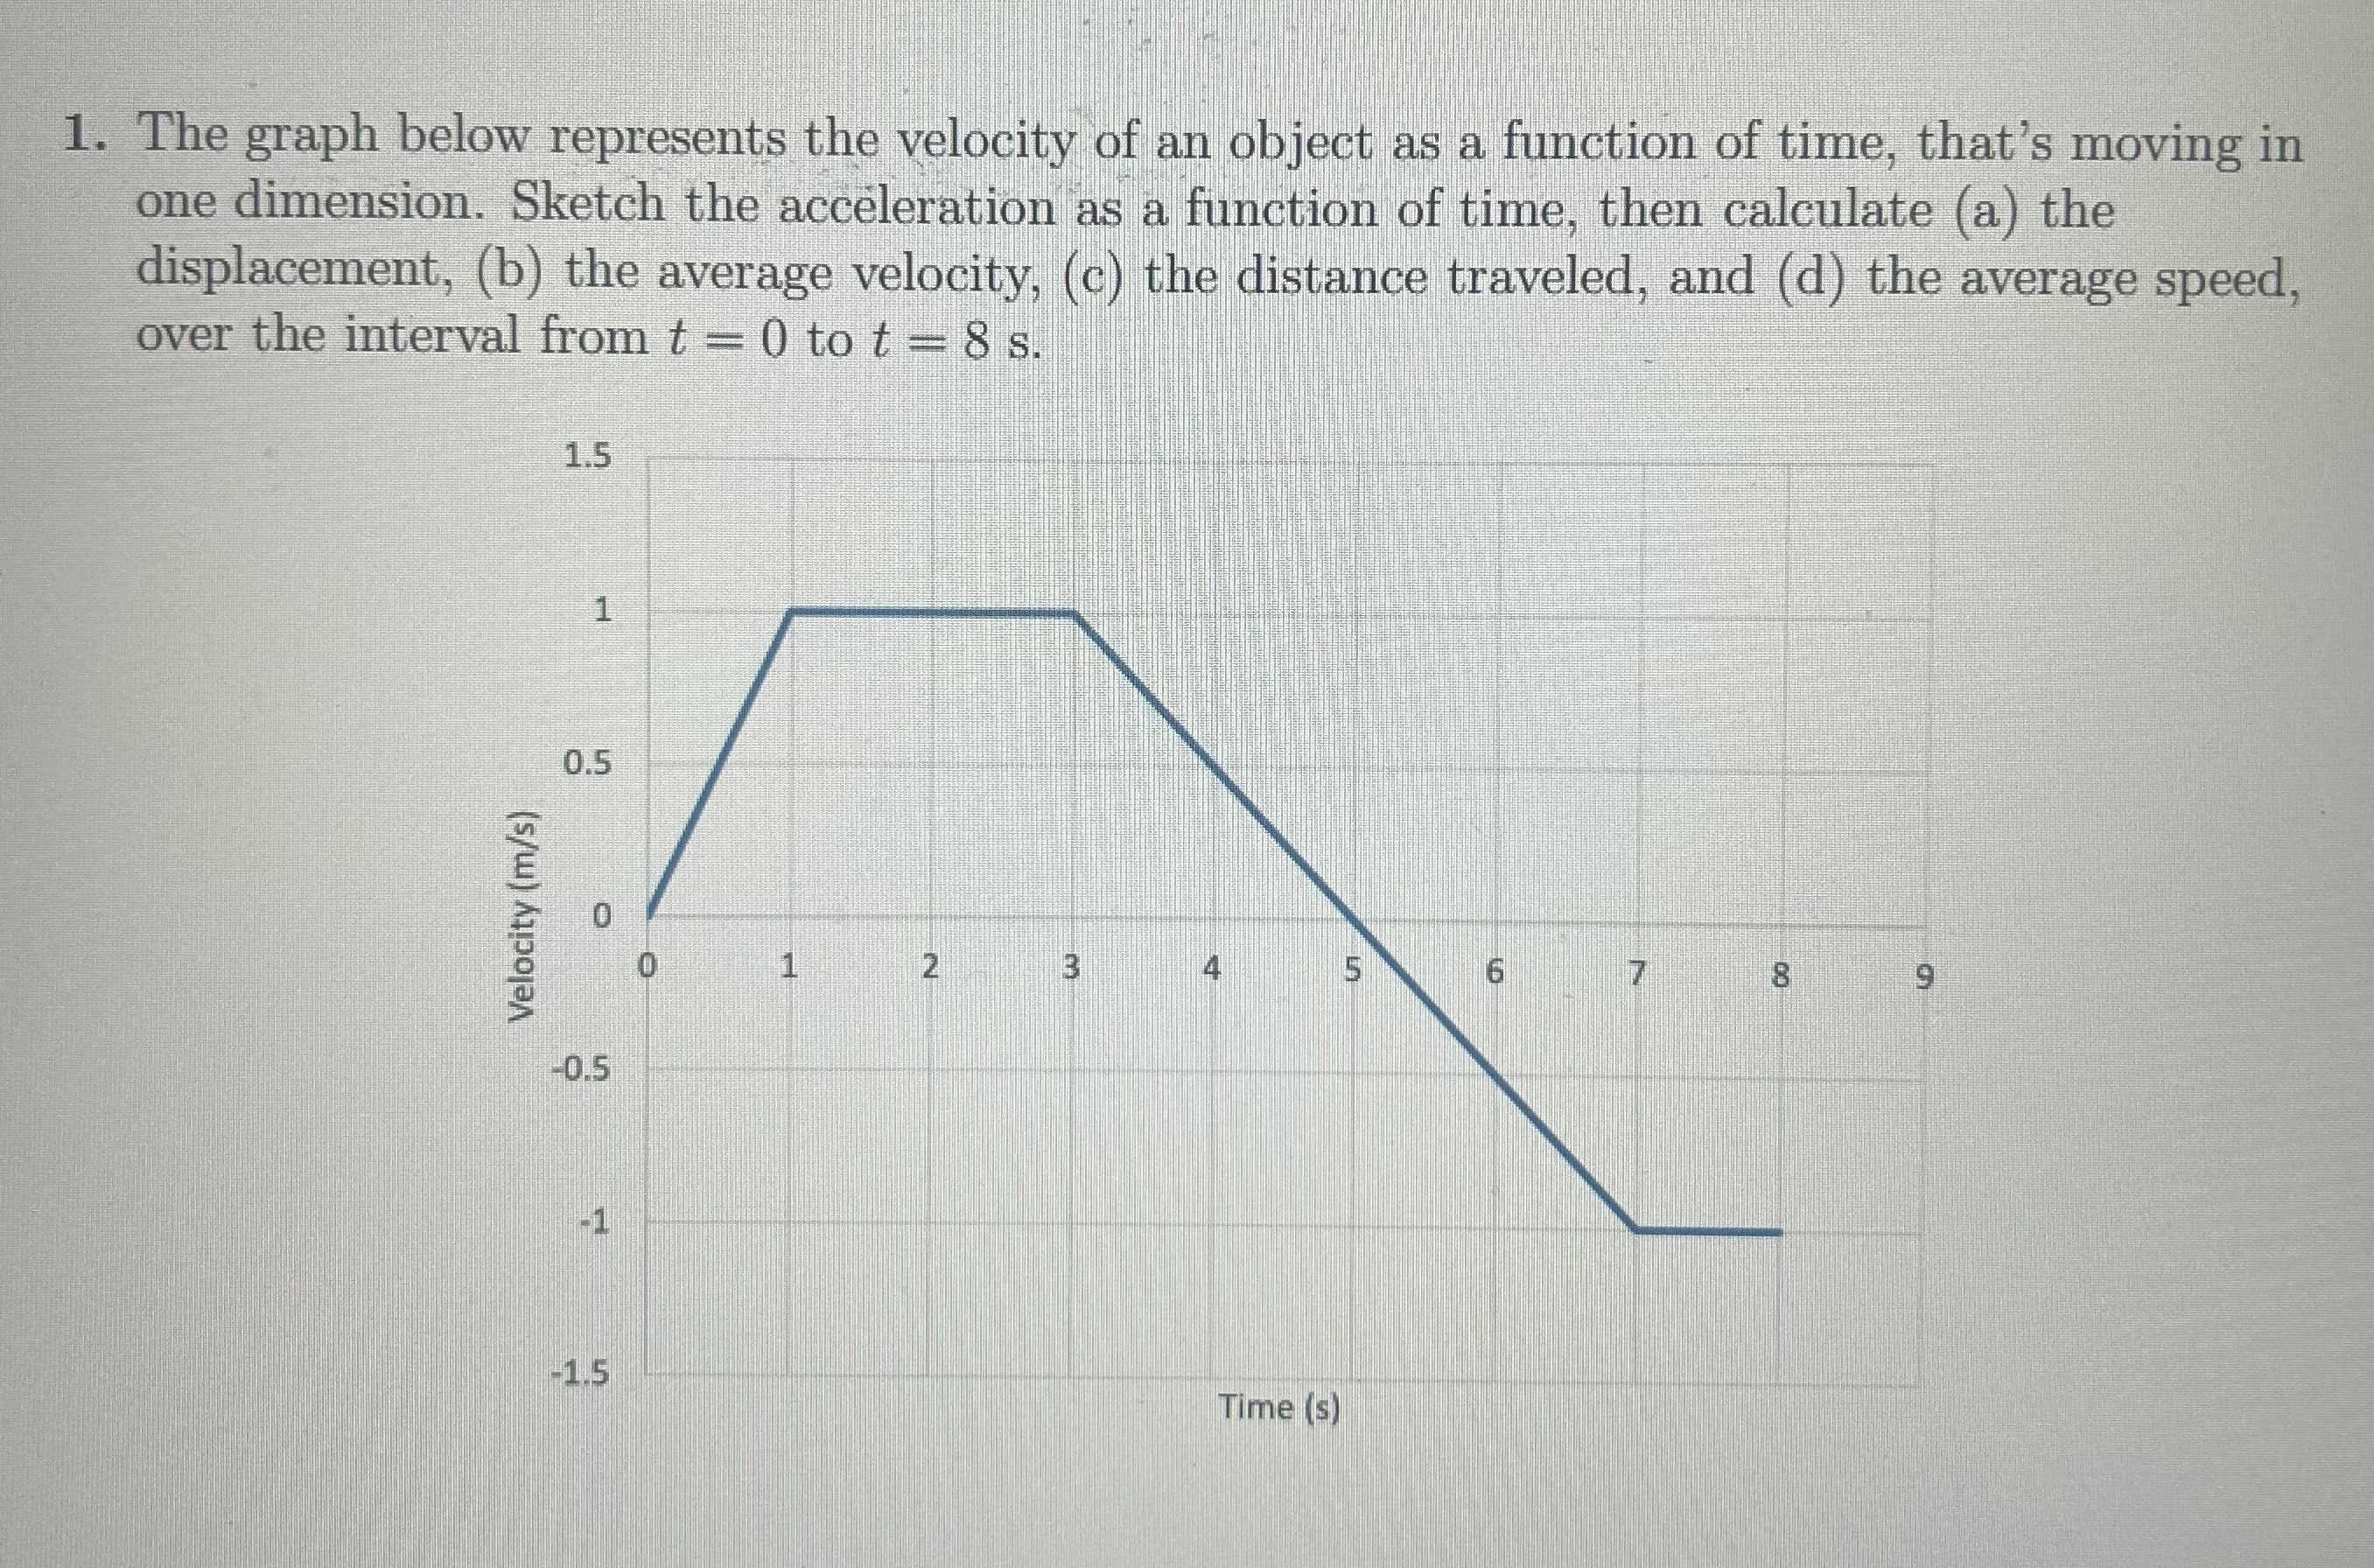
1. The graph below represents the velocity of an object as a function of time, that's moving in one dimension. Sketch the acceleration as a function of time, then calculate (a) the displacement, (b) the average velocity, (c) the distance traveled, and (d) the average speed, over the interval from t = 0 to t = 8 s. Velocity (m/s) 1.5 1 0.5 -0.5 -1 -1.5 0 1 2 MA 43 Time (s) 6 8 9
Step by Step Solution
There are 3 Steps involved in it
Step: 1

Get Instant Access to Expert-Tailored Solutions
See step-by-step solutions with expert insights and AI powered tools for academic success
Step: 2

Step: 3

Ace Your Homework with AI
Get the answers you need in no time with our AI-driven, step-by-step assistance
Get StartedRecommended Textbook for
Chemistry A Molecular Approach
Authors: Nivaldo Tro
5th Edition
0134874374, 978-0134874371
Students also viewed these Physics questions
Question
Answered: 1 week ago
Question
Answered: 1 week ago
Question
Answered: 1 week ago
Question
Answered: 1 week ago
Question
Answered: 1 week ago
Question
Answered: 1 week ago
Question
Answered: 1 week ago
Question
Answered: 1 week ago
Question
Answered: 1 week ago
Question
Answered: 1 week ago
Question
Answered: 1 week ago
Question
Answered: 1 week ago
Question
Answered: 1 week ago
Question
Answered: 1 week ago
Question
Answered: 1 week ago
Question
Answered: 1 week ago
Question
Answered: 1 week ago
Question
Answered: 1 week ago
Question
Answered: 1 week ago
Question
Answered: 1 week ago
Question
Answered: 1 week ago
View Answer in SolutionInn App


