

Answered step by step
Verified Expert Solution
Question
1 Approved Answer
1. The graphic below is an example of a GG pairs plot. For each of the following results, explain what is being portrayed, what type
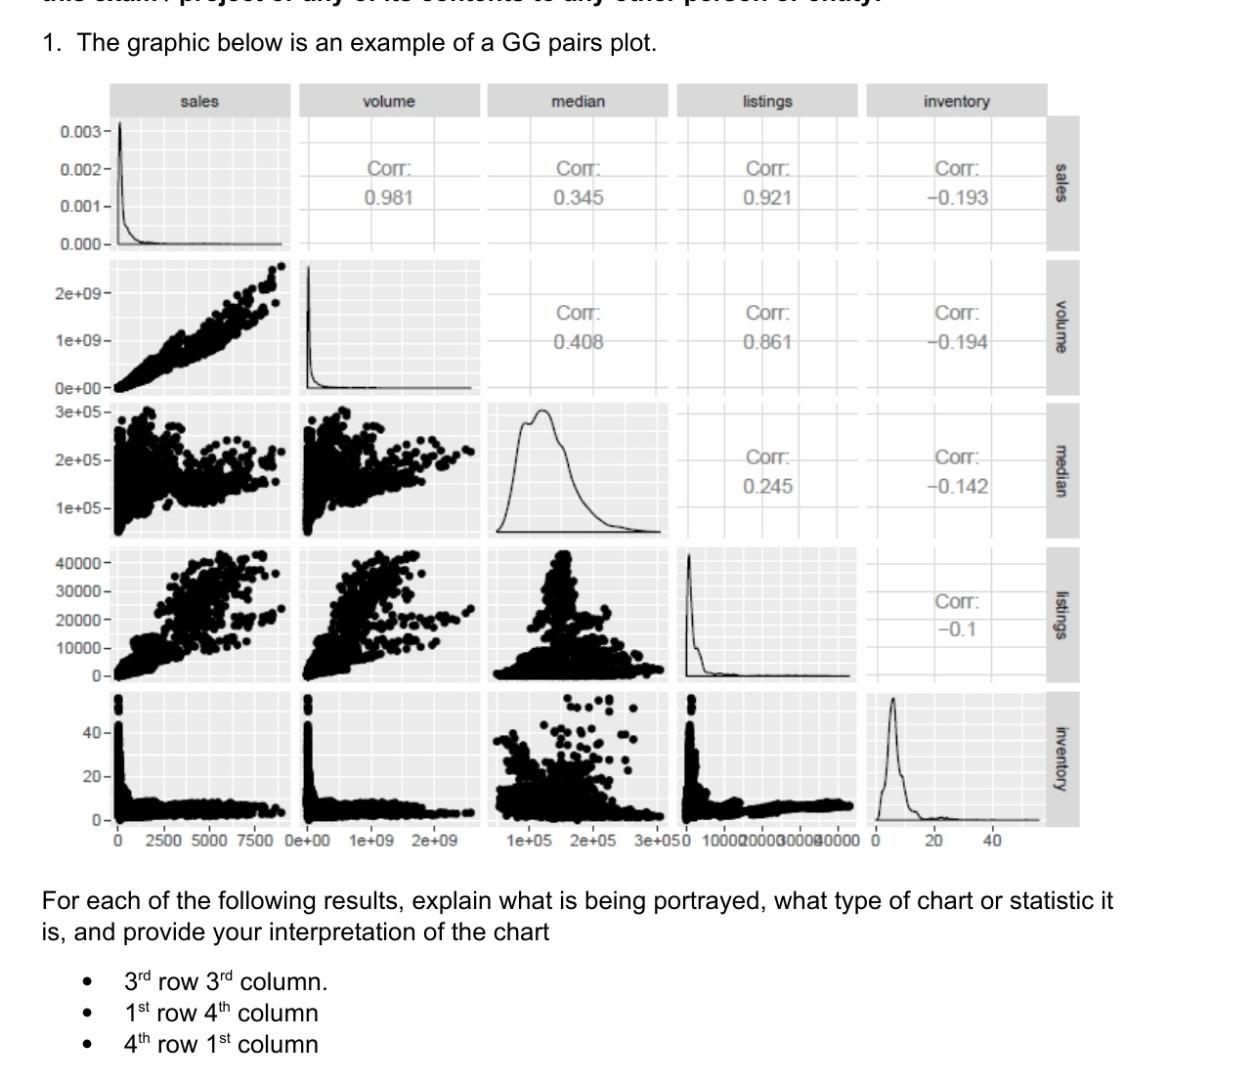
1. The graphic below is an example of a GG pairs plot. For each of the following results, explain what is being portrayed, what type of chart or statistic it is, and provide your interpretation of the chart - 3rd row 3rd column. - 1st row 4th column - 4th row 1st column
Step by Step Solution
There are 3 Steps involved in it
Step: 1

Get Instant Access to Expert-Tailored Solutions
See step-by-step solutions with expert insights and AI powered tools for academic success
Step: 2

Step: 3
Ace Your Homework with AI
Get the answers you need in no time with our AI-driven, step-by-step assistance
Get Started
Intranet And Web Databases For Dummies
Authors: Paul Litwin
1st Edition
0764502212, 9780764502217