Answered step by step
Verified Expert Solution
Question
1 Approved Answer
1. The JPY/USD spot rates used to create slide 27 in Session 10/12 are in a spreadsheet named USDJPY_2020f on NYU Classes. a. Calculate

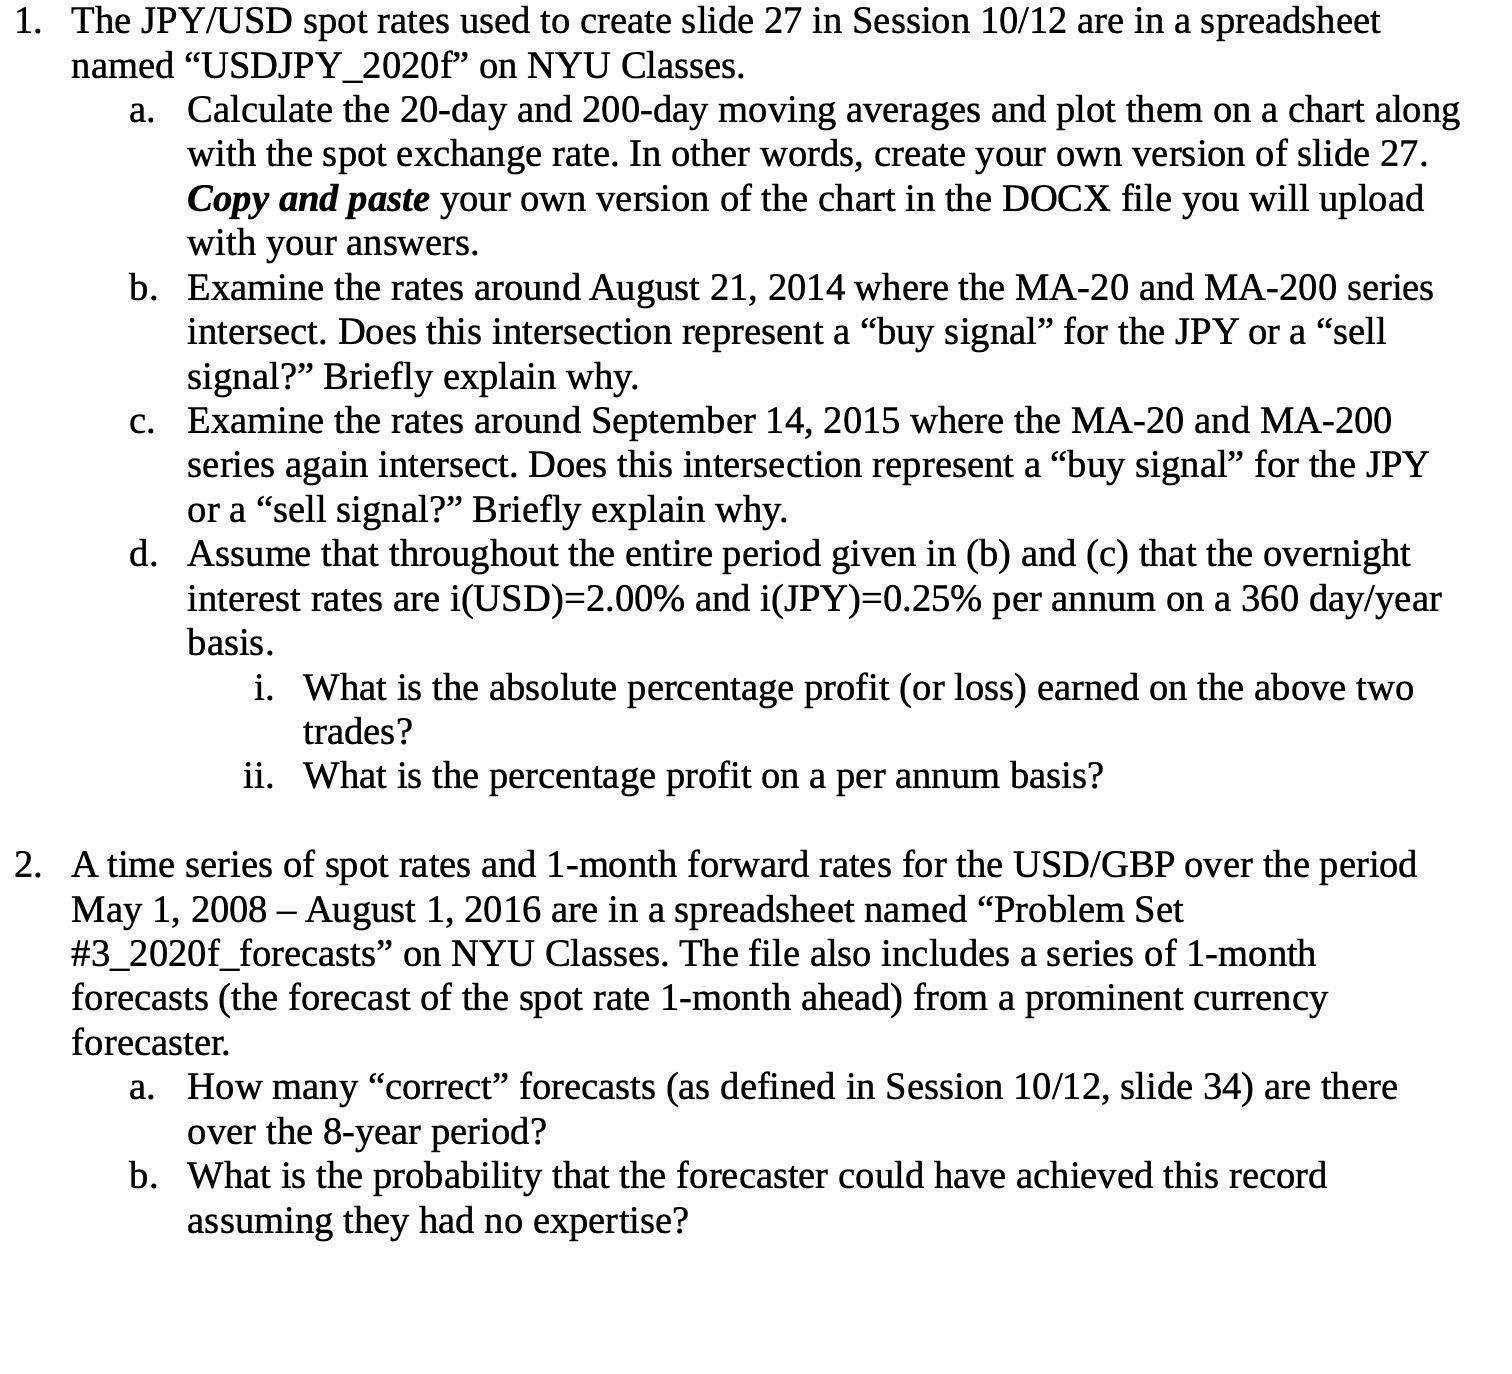
1. The JPY/USD spot rates used to create slide 27 in Session 10/12 are in a spreadsheet named "USDJPY_2020f" on NYU Classes. a. Calculate the 20-day and 200-day moving averages and plot them on a chart along with the spot exchange rate. In other words, create your own version of slide 27. Copy and paste your own version of the chart in the DOCX file you will upload with your answers. b. Examine the rates around August 21, 2014 where the MA-20 and MA-200 series intersect. Does this intersection represent a "buy signal" for the JPY or a "sell signal? Briefly explain why. c. Examine the rates around September 14, 2015 where the MA-20 and MA-200 series again intersect. Does this intersection represent a buy signal" for the JPY or a "sell signal?" Briefly explain why. d. Assume that throughout the entire period given in (b) and (c) that the overnight interest rates are i(USD)=2.00% and i(JPY)=0.25% per annum on a 360 day/year basis. i. What is the absolute percentage profit (or loss) earned on the above two trades? ii. What is the percentage profit on a per annum basis? 2. A time series of spot rates and 1-month forward rates for the USD/GBP over the period May 1, 2008- August 1, 2016 are in a spreadsheet named "Problem Set #3_2020f_forecasts" on NYU Classes. The file also includes a series of 1-month forecasts (the forecast of the spot rate 1-month ahead) from a prominent currency forecaster. a. How many "correct" forecasts (as defined in Session 10/12, slide 34) are there over the 8-year period? b. What is the probability that the forecaster could have achieved this record assuming they had no expertise?
Step by Step Solution
★★★★★
3.48 Rating (164 Votes )
There are 3 Steps involved in it
Step: 1
1a See the chart pasted in the Word document 1b At the intersection on August 21 2014 the MA20 line ...
Get Instant Access to Expert-Tailored Solutions
See step-by-step solutions with expert insights and AI powered tools for academic success
Step: 2

Step: 3

Ace Your Homework with AI
Get the answers you need in no time with our AI-driven, step-by-step assistance
Get Started


