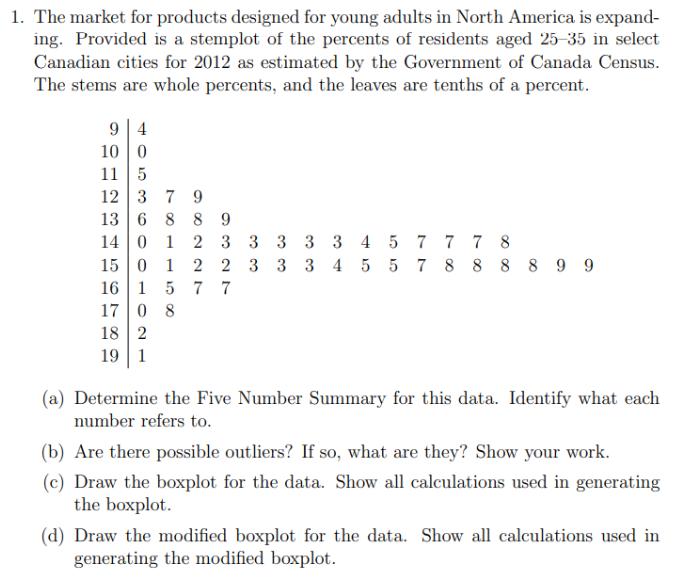
1. The market for products designed for young adults in North America is expand- ing. Provided is a stemplot of the percents of residents

1. The market for products designed for young adults in North America is expand- ing. Provided is a stemplot of the percents of residents aged 25-35 in select Canadian cities for 2012 as estimated by the Government of Canada Census. The stems are whole percents, and the leaves are tenths of a percent. 94 10 0 11 5 12 3 7 9 13 6 8 8 9 14 0 1 2 3 3 3 3 3 4 5 7 778 15 0 1 16 1 5 17 08 18 2 19 1 2 2 3 3 34 5 5 7 8 8 8 89 9 7 7 (a) Determine the Five Number Summary for this data. Identify what each number refers to. (b) Are there possible outliers? If so, what are they? Show your work. (c) Draw the boxplot for the data. Show all calculations used in generating the boxplot. (d) Draw the modified boxplot for the data. Show all calculations used in generating the modified boxplot.
Step by Step Solution
3.38 Rating (151 Votes )
There are 3 Steps involved in it
Step: 1
To determine the fivenumber summary for the given data we need to arrange the data in ascending orde...
See step-by-step solutions with expert insights and AI powered tools for academic success
Step: 2

Step: 3

Ace Your Homework with AI
Get the answers you need in no time with our AI-driven, step-by-step assistance
Get Started


