

Answered step by step
Verified Expert Solution
Question
1 Approved Answer
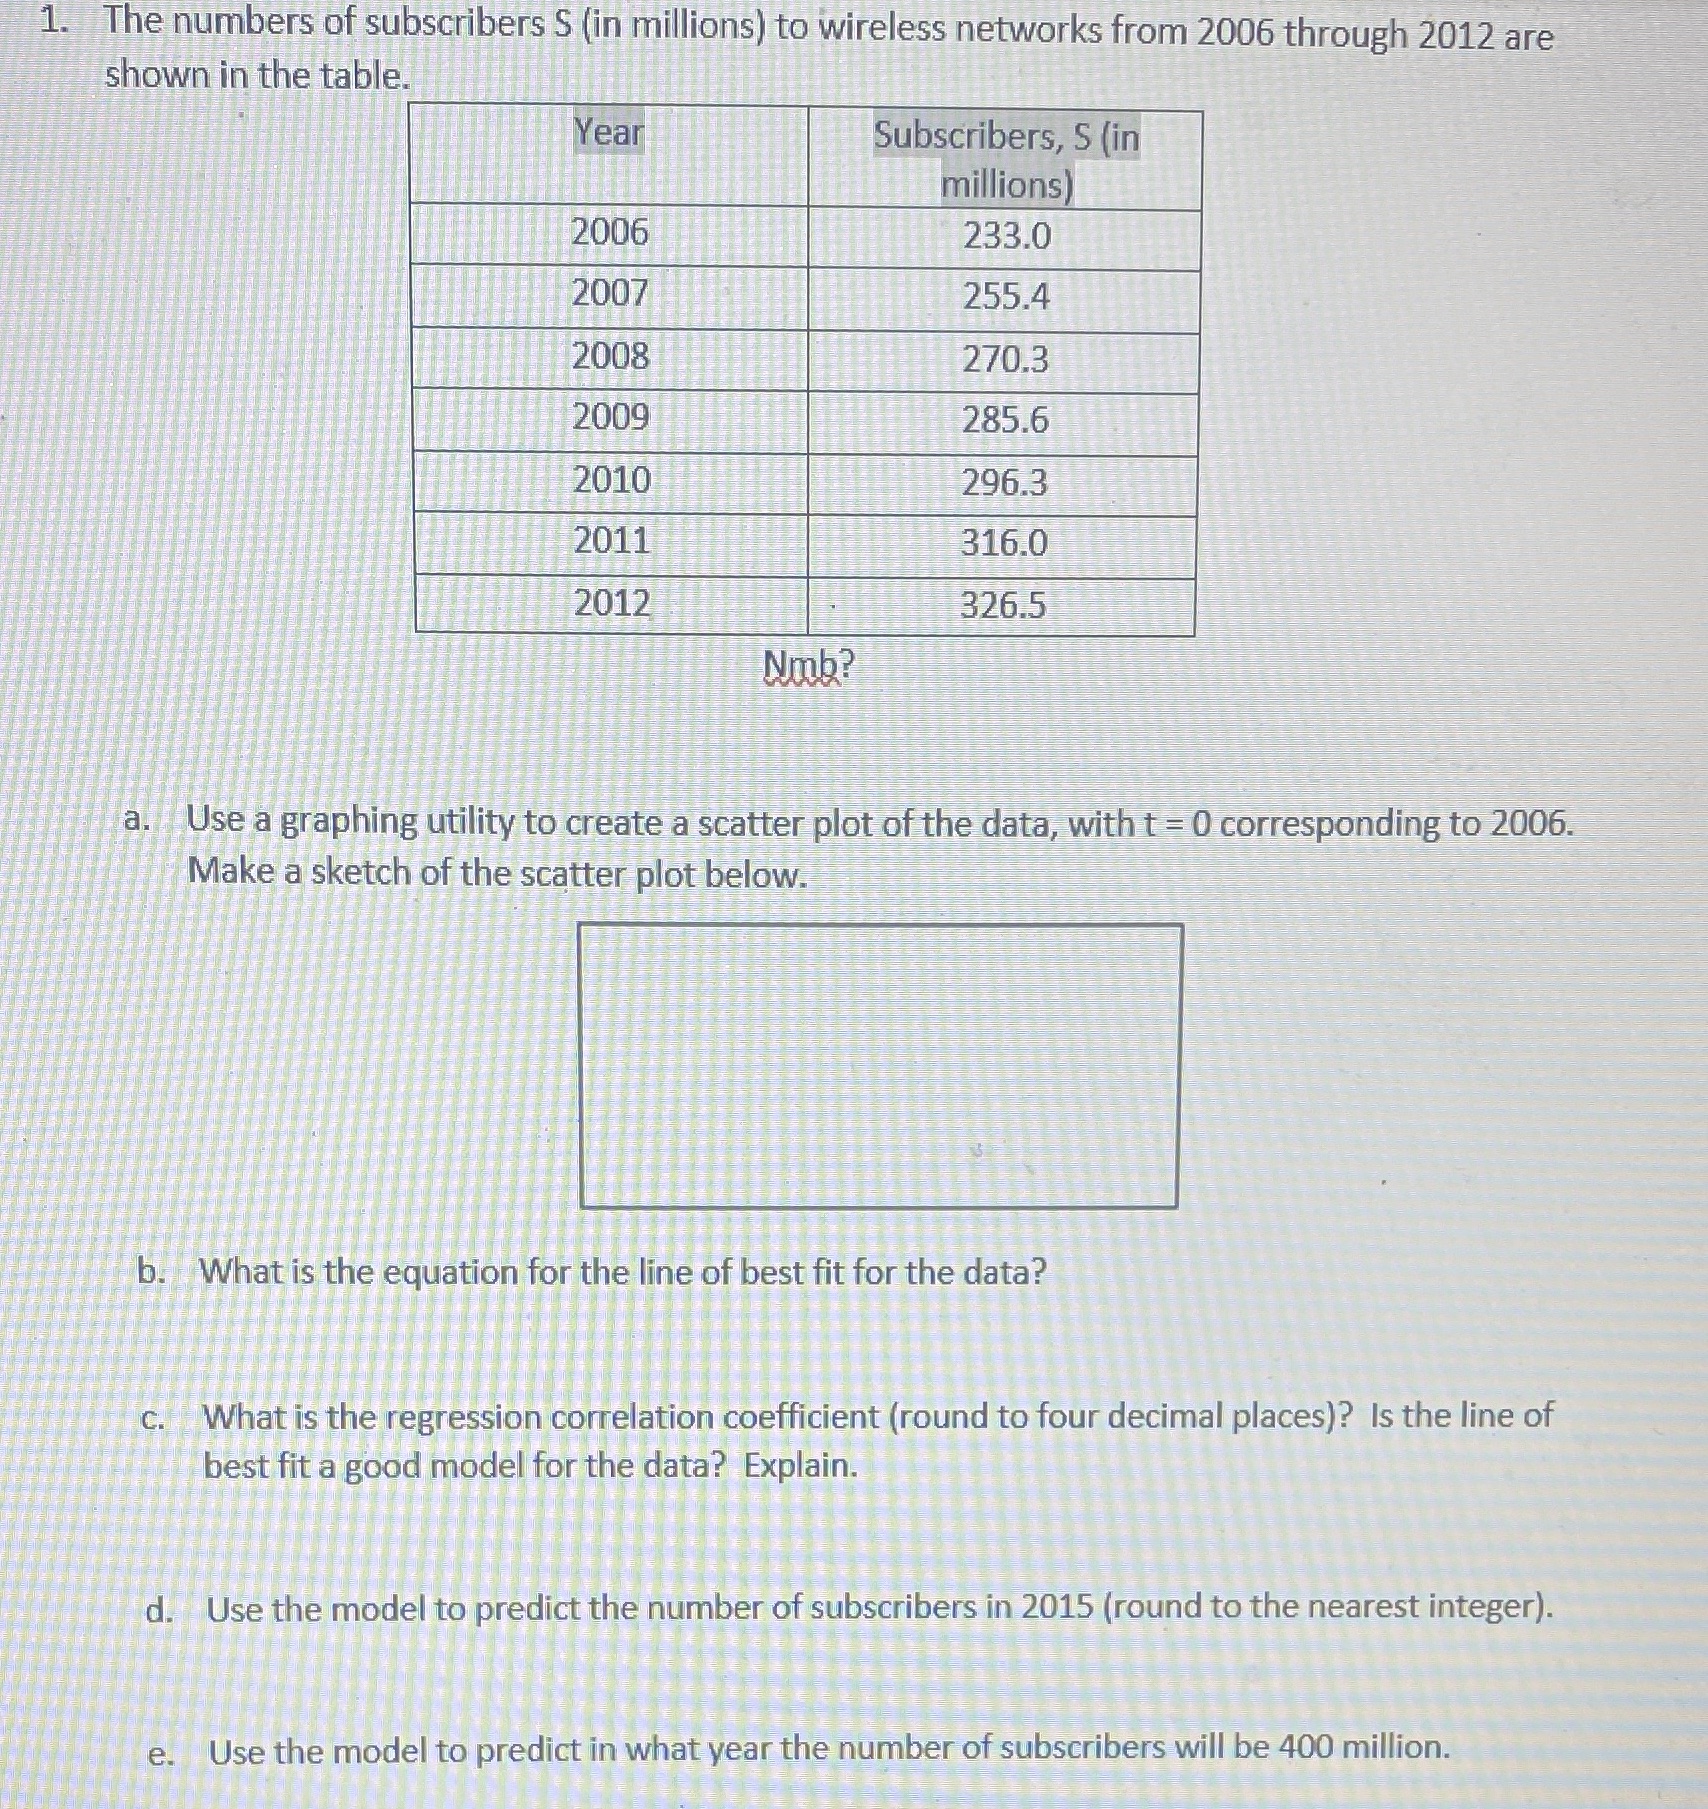
1. The numbers of subscribers S (in millions) to wireless networks from 2006 through 2012 are shown in the table. Year Subscribers, S (in millions)

Step by Step Solution
There are 3 Steps involved in it
Step: 1

Get Instant Access to Expert-Tailored Solutions
See step-by-step solutions with expert insights and AI powered tools for academic success
Step: 2

Step: 3
Ace Your Homework with AI
Get the answers you need in no time with our AI-driven, step-by-step assistance
Get Started
Mathematical Logic Foundations For Information Science
Authors: Wei Li
2nd Edition
3034808623, 9783034808620