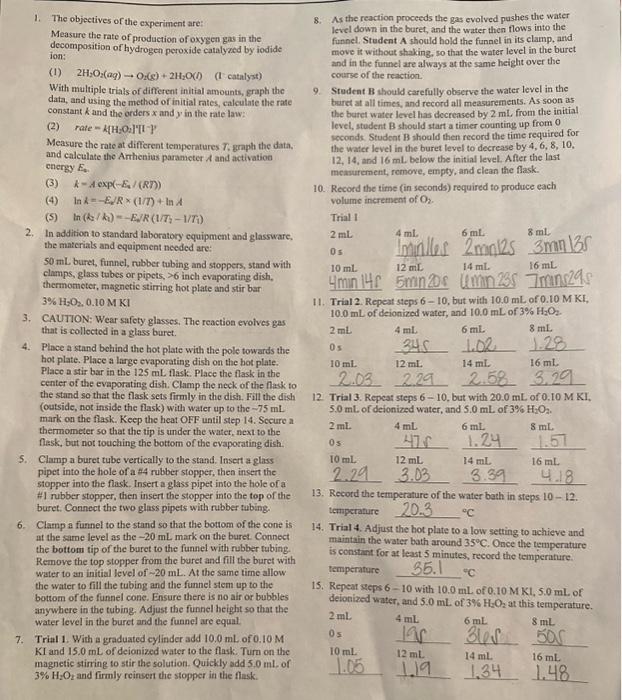
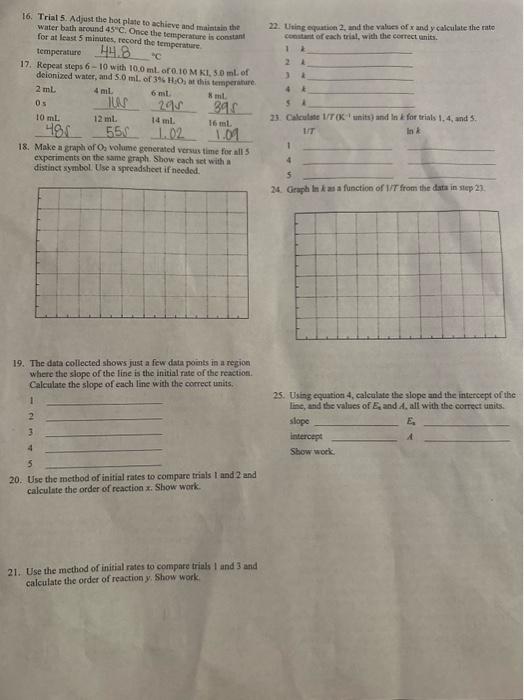
1. The objectives of the experiment are: 8. As the reaction proceeds the gas evolved pushes the water Measure the rate of production of oxygen gas in the level down in the buret, and the water then flows into the decomposition of hydrogen peroxide catalyzed by iodide funnel. Student A should hold the funnel in its clamp, and (1) 2H2O2(aq)O2(g)+2H2O(I) (t catalyst) move it without shaking, so that the water level in the buret and in the funnel are always at the same height over the With multiple trials of different initial amounts, graph the course of the reaction. data, and using the method of initial rates, calculate the rate 9. Student B should carefully obscrve the water level in the constant k and the orders x and y in the rate lawz burct at all times, and record all measurements. As soon as (2) rate =k[H2,O2]HI} the baret watec level has decreased by 2ml. from the initial Measure the rate at different temperatures T, graph the data. level, student B should start a timer cocinting up from 0 and calcelate the Amhenius parameter A and activation soconds. Student B should then record the time required for cacrgy E4. (3) k=Aexp(E4/(RD)) the watce level in the buret level to decrease by 4,6,8,10, (4) lnk=EV/R(1/7)+lnA 12, 14, and 16ml below the initial level. After the last (5) ln(k2/k1)=E0/R(1/T71/T1) measurement, remove, empty, and clean the flask. 3%H2O2,0.10MKI 10. Record the time (in seconds) required to produce each volume increment of O. 11. Trial 2. Repeat steps 610, but with 10.0mL of 0.10MKI, 3. CAUTION: Wear safety glasses. The reaction evolves gas that is collected in a glass buret. 4. Place a stand behind the hot plate with the pole towards the hot plate. Place a large evaporating dish on the hot plate. Place a stir bar in the 125 mL. flask. Place the flask in the center of the evaporating dish. Clamp the neck of the flask to 10.0mL of deionized water, and 10.0mL of 3%.H2O2. the stand so that the flask sets firmly in the dish. Fill the dish (outside, not inside the flask) with water up to the 75mL. mark on the flask. Keep the heat OFF until step 14. Secure a thermometer so that the tip is under the water, nexi to the fiesk, but not touching the bottom of the cvaporating dish. 5. Clamp a buret tube vertically to the stand. Insert a glass pipet into the hole of a 14 rubber stopper, then insert the stopper into the flask. Insert a glass pipet into the hole of a \#1 nuber stopper, then insert the stopper into the top of the buret. Connect the two glass pipets with rubber tabing. 13. Record the temperature of the water bath in steps 1012. 12. Trial 3. Repeat steps 610, but with 20.0mL of 0.10MXI. 5.0mL of deionized water, and 5.0mL of 3%H2O2. Clamp a funnel to the stand so that the bottom of the cone is at the same level as the 20mL mark on the buret. Connect 14. Trial 4. Adjust the hot plate to a low setting to achieve and the bottom tip of the buret to the funnel with nubber fubing. maintain the water bath around 35C. Once the temperature Remove the top stopper from the beret and fill the buret with water to an initial level of 20mL. At the same time allow is constant for at least 5 minutes, record the temperahure. the water to fill the tubing and the funnel stem up to the bottom of the funnel cone. Ensure there is no air or bubbles anywhere in the tubing. Adjust the funnel height so that the water level in the buret and the funnel are equal. 7. Trial 1. With a graduated cylinder add 10.0mL of 0.10M KI and 15.0mL of deionized water to the flask. Turn on the magnetic stirring to stir the solution. Quickly add 5.0ml of 3%H2O2 and firmly reinsert the stopper in the flisk. 15. Repeat zepe 610 with 10.0mL of 0.10MKl,5.0ml of deionized water, and 5.0mL of 3%H2O2 at this temperature. 16. Trial 5. Adjust the hot plase to achieve and thaintaio the water bath aroand 45:C. Once the temperature is constant 22. Uring equation 2, and the values of x and y calculate the rate for at least 5 mizutes, tecord the temperature. temperaturo 4H.C 18. Make a graph of O2 volame genecated versus time for alls experiments on the same sraph. Sbow cach sict with a distinct symbol. Use a spreadsheet if needed. 19. The data collected shows just a few data points in a region where she slope of the line is the initial nate of the reaction. Calenlate the slope of each line with the correct umits. 1 2 3 4 5 25. Using ecuation 4, calcalate the slope and the intercept of the ine, and the valaes of Ex and A, all with the cotrect units: slope Ek intercept A Slow work: 20. Use the method of initial rates to compare trials I and 2 and calculate the order of reaction x. Sbow work. 21. Use the method of initial rotes to compare trials I and 3 and calculate the ordet of reaction y. Show work


