

Question
1 The plot below shows a frequency distribution in gray bars and a normal probability distribution as a red line Frequency Enter here 10 8

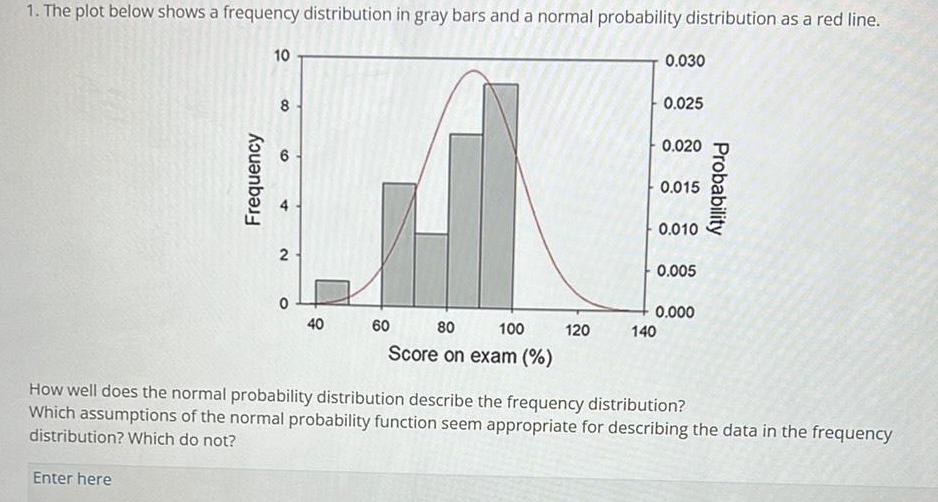
1 The plot below shows a frequency distribution in gray bars and a normal probability distribution as a red line Frequency Enter here 10 8 8 2 0 40 60 80 100 Score on exam 120 0 030 140 0 025 0 020 0 015 0 010 0 005 0 000 Probability How well does the normal probability distribution describe the frequency distribution Which assumptions of the normal probability function seem appropriate for describing the data in the frequency distribution Which do not
Step by Step Solution
There are 3 Steps involved in it
Step: 1

Get Instant Access to Expert-Tailored Solutions
See step-by-step solutions with expert insights and AI powered tools for academic success
Step: 2

Step: 3
Ace Your Homework with AI
Get the answers you need in no time with our AI-driven, step-by-step assistance
Get Started
Textbook Of Co-ordinate Geometry
Authors: Mofidul Islam
1st Edition
9353147824, 9789353147822