

Answered step by step
Verified Expert Solution
Question
1 Approved Answer
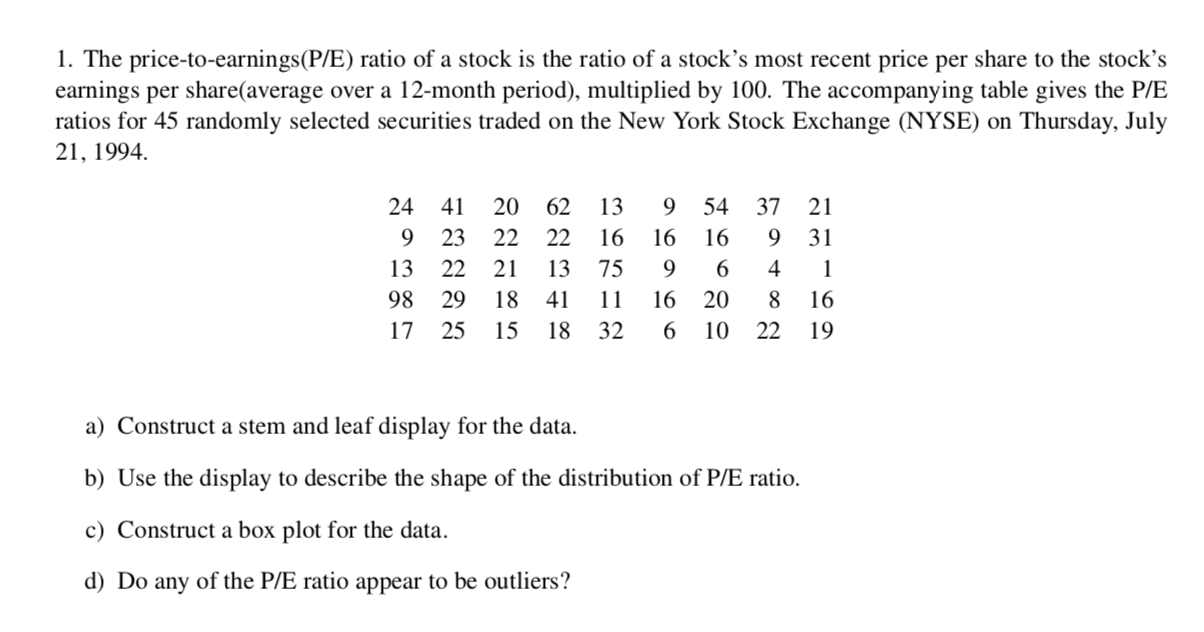
1. The price-to-earnings(P/E) ratio of a stock is the ratio of a stock's most recent price per share to the stock's earnings per share(average over
Step by Step Solution
There are 3 Steps involved in it
Step: 1

Get Instant Access to Expert-Tailored Solutions
See step-by-step solutions with expert insights and AI powered tools for academic success
Step: 2

Step: 3
Ace Your Homework with AI
Get the answers you need in no time with our AI-driven, step-by-step assistance
Get Started
Principles Of Project Finance
Authors: E.R. Yescombe
1st Edition
0127708510, 978-0127708515