Answered step by step
Verified Expert Solution
Link Copied!

Question

1 Approved Answer

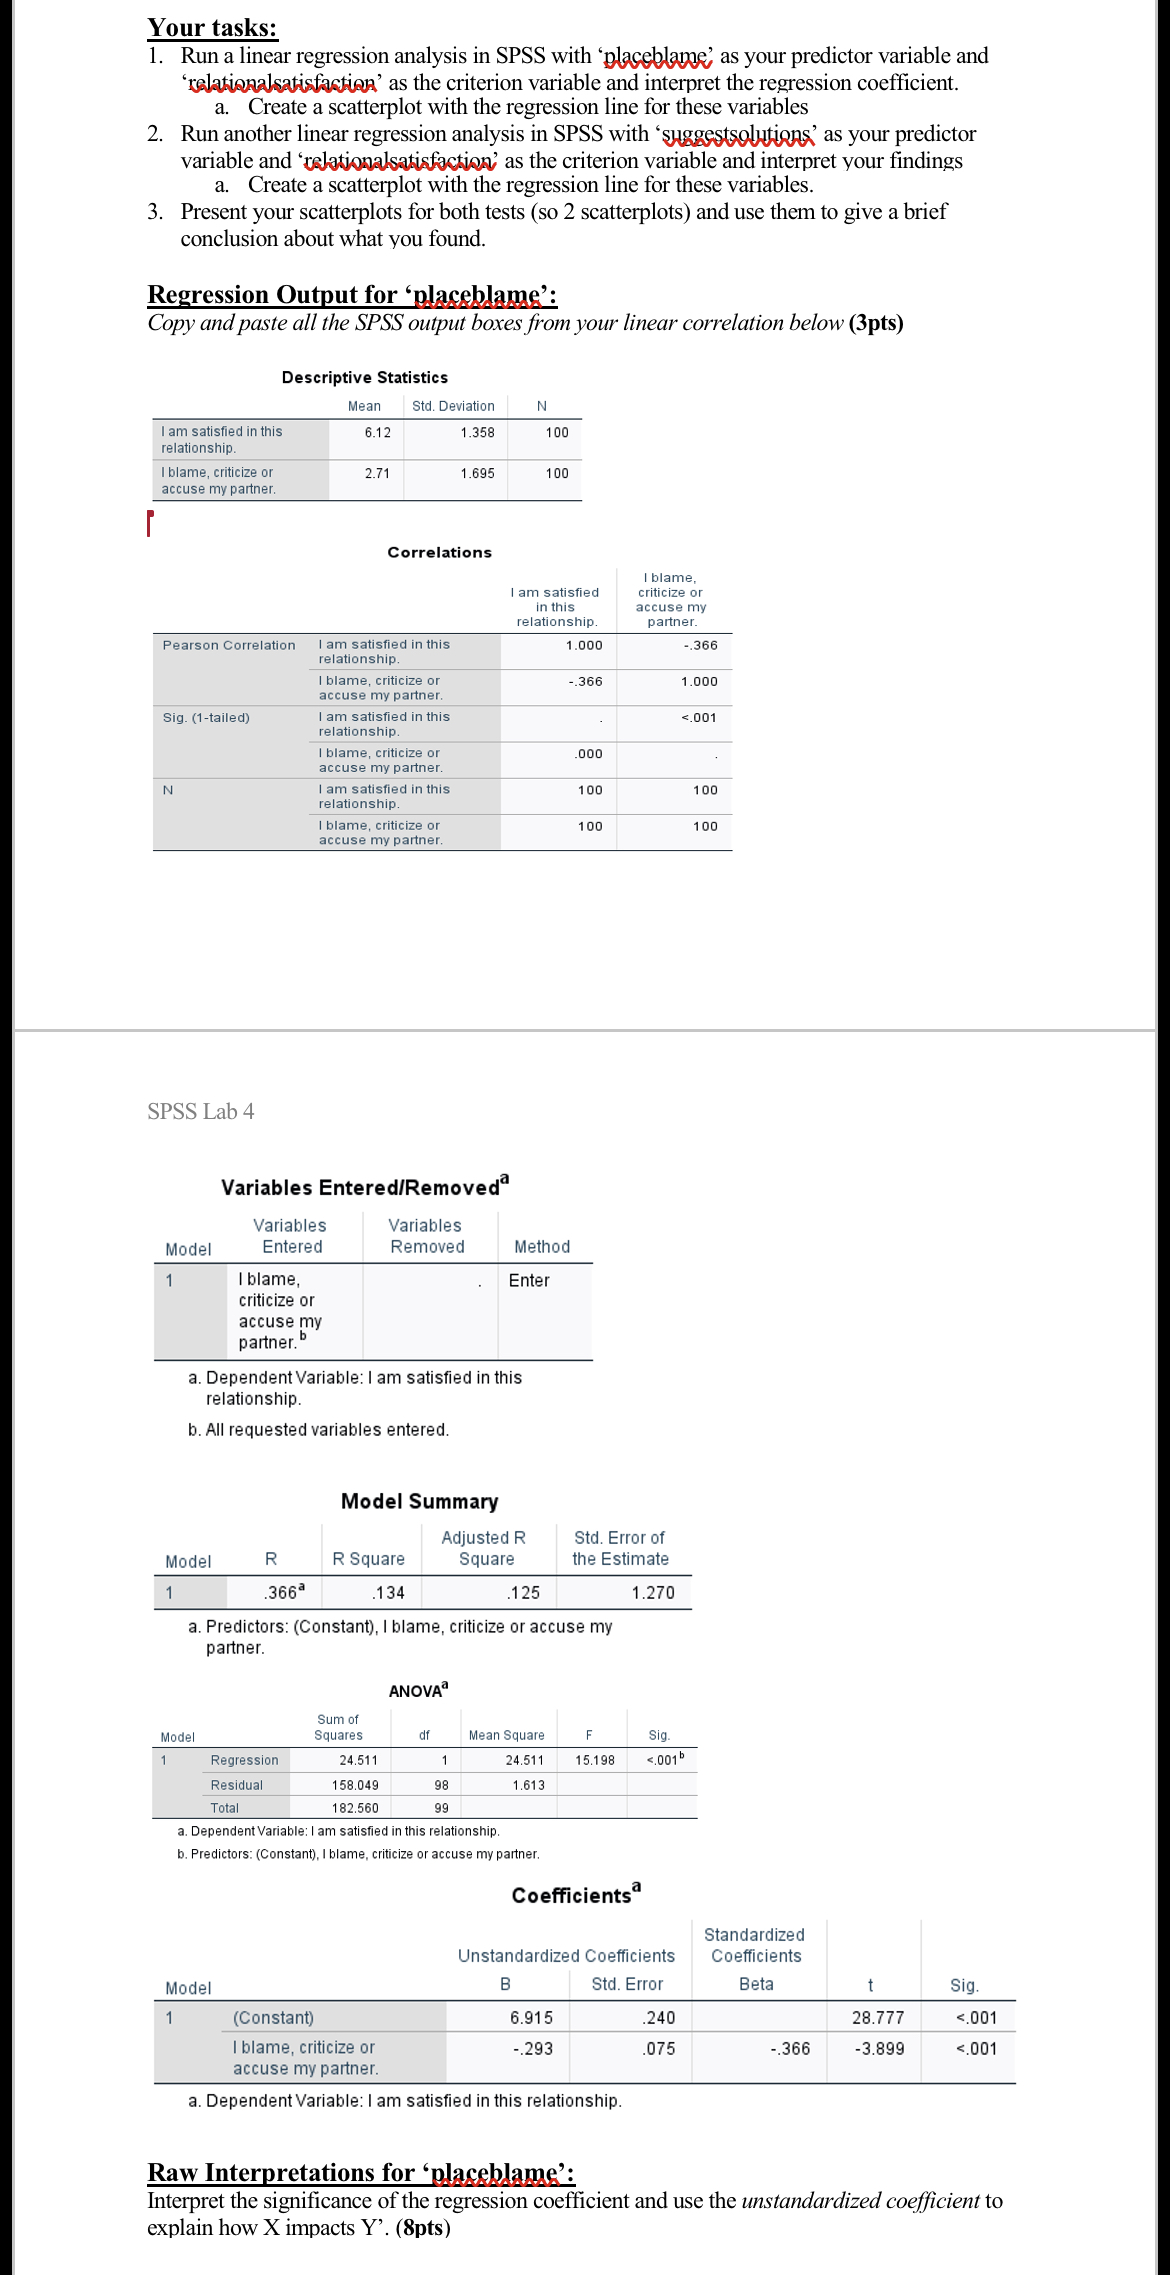
1. The raw interpretation for placeblame - Interpret the significance of the regression coefficient and use the unstandardized coefficient to explain how X impacts Y'.

1. The raw interpretation for "placeblame" - Interpret the significance of the regression coefficient and use the unstandardized coefficient to explain how X impacts Y'. (spss information can be seen in the first attachment)

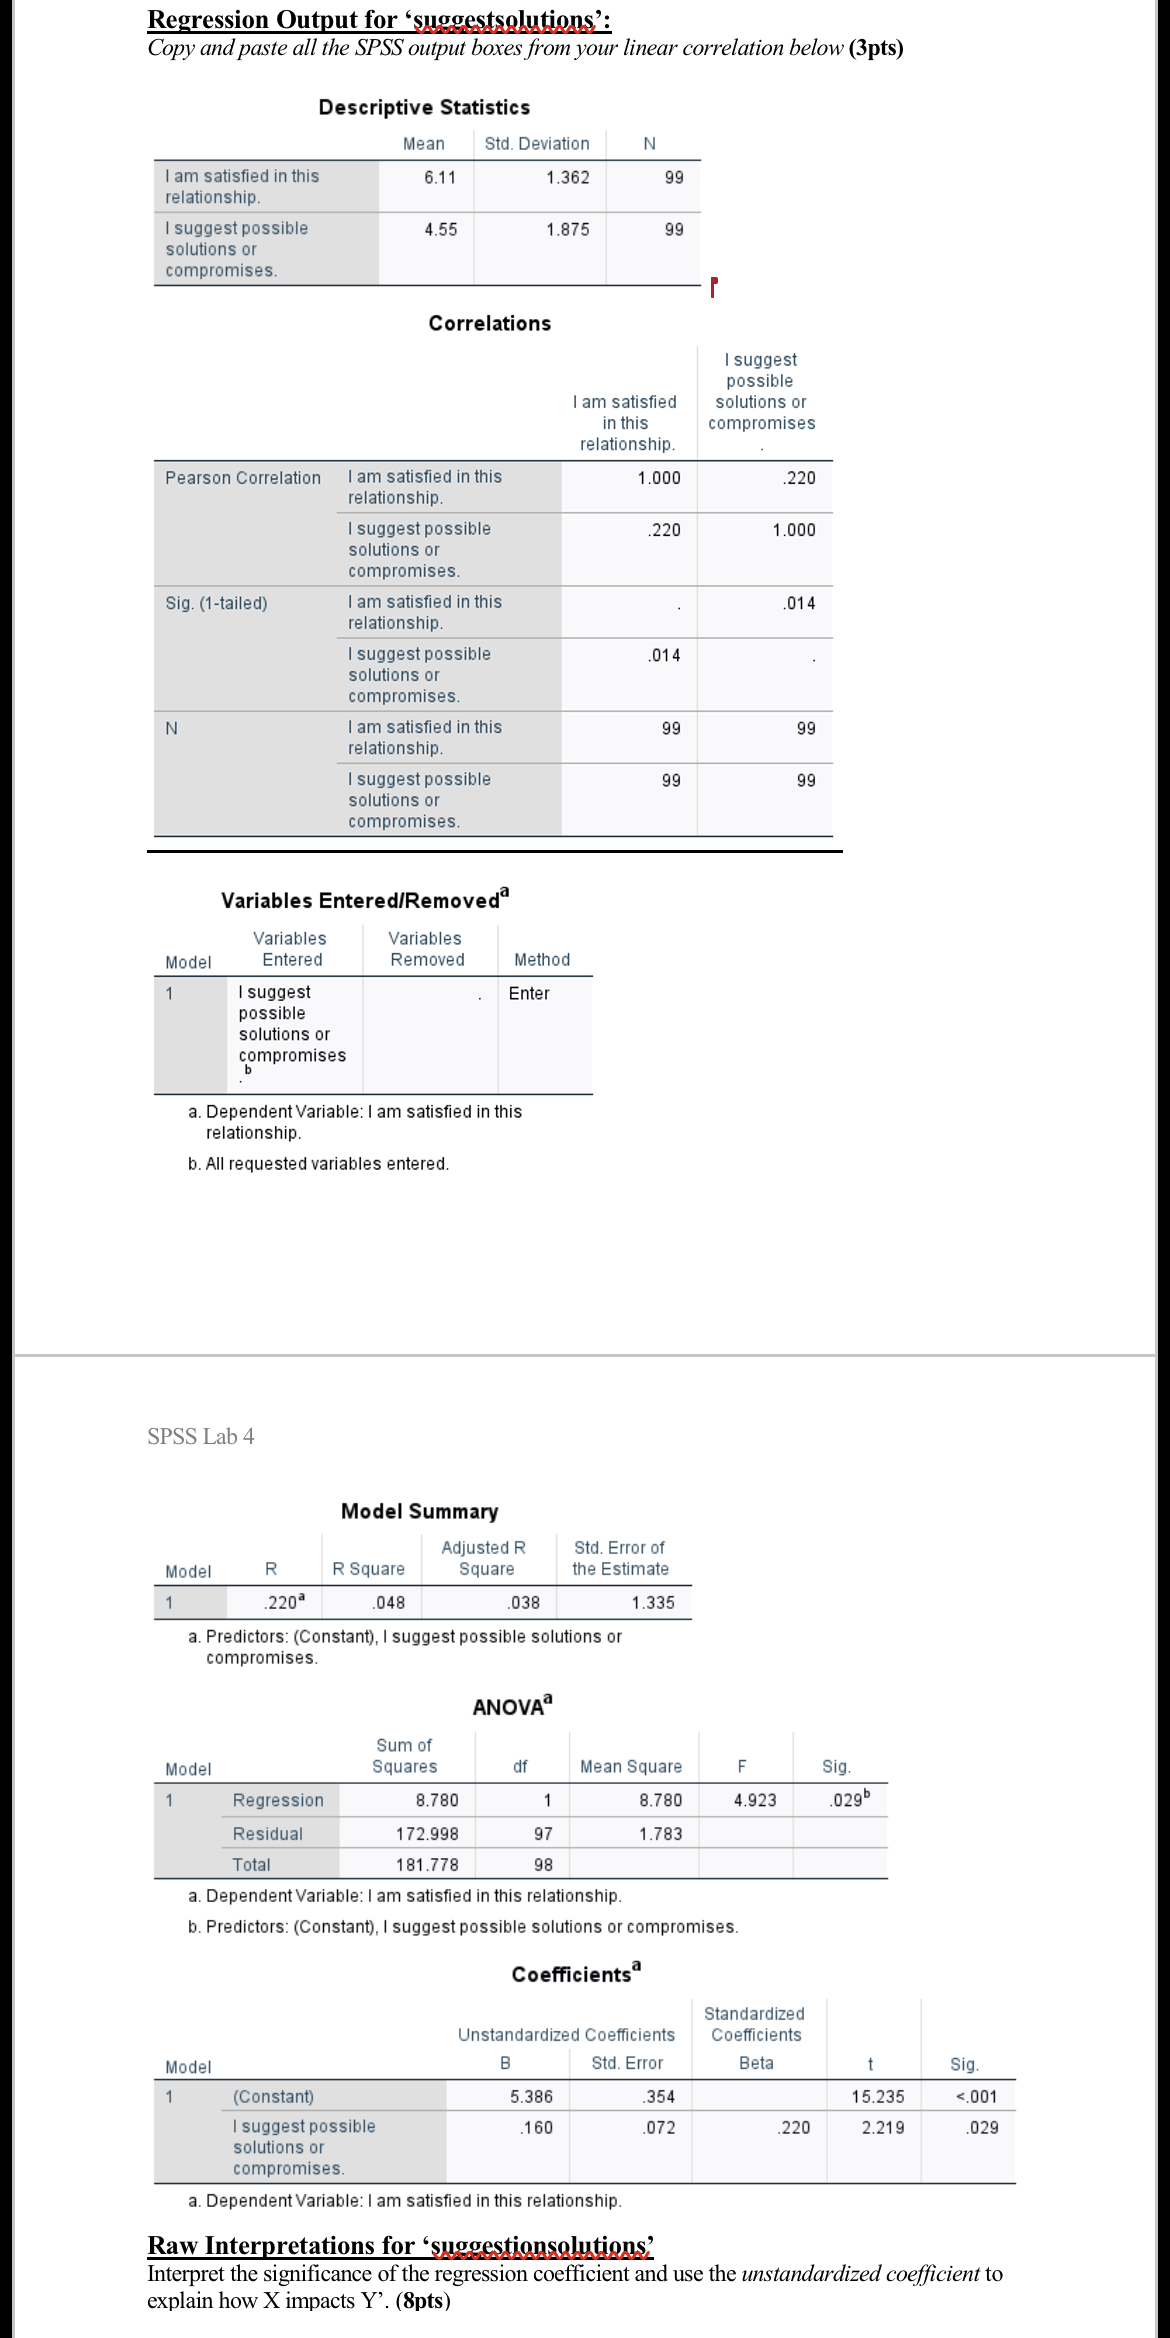
2. The raw interpretation for "suggestsolutions" - Interpret the significance of the regression coefficient and use the unstandardized coefficient to explain how X impacts Y'.(spss information can be seen in the second attachment)

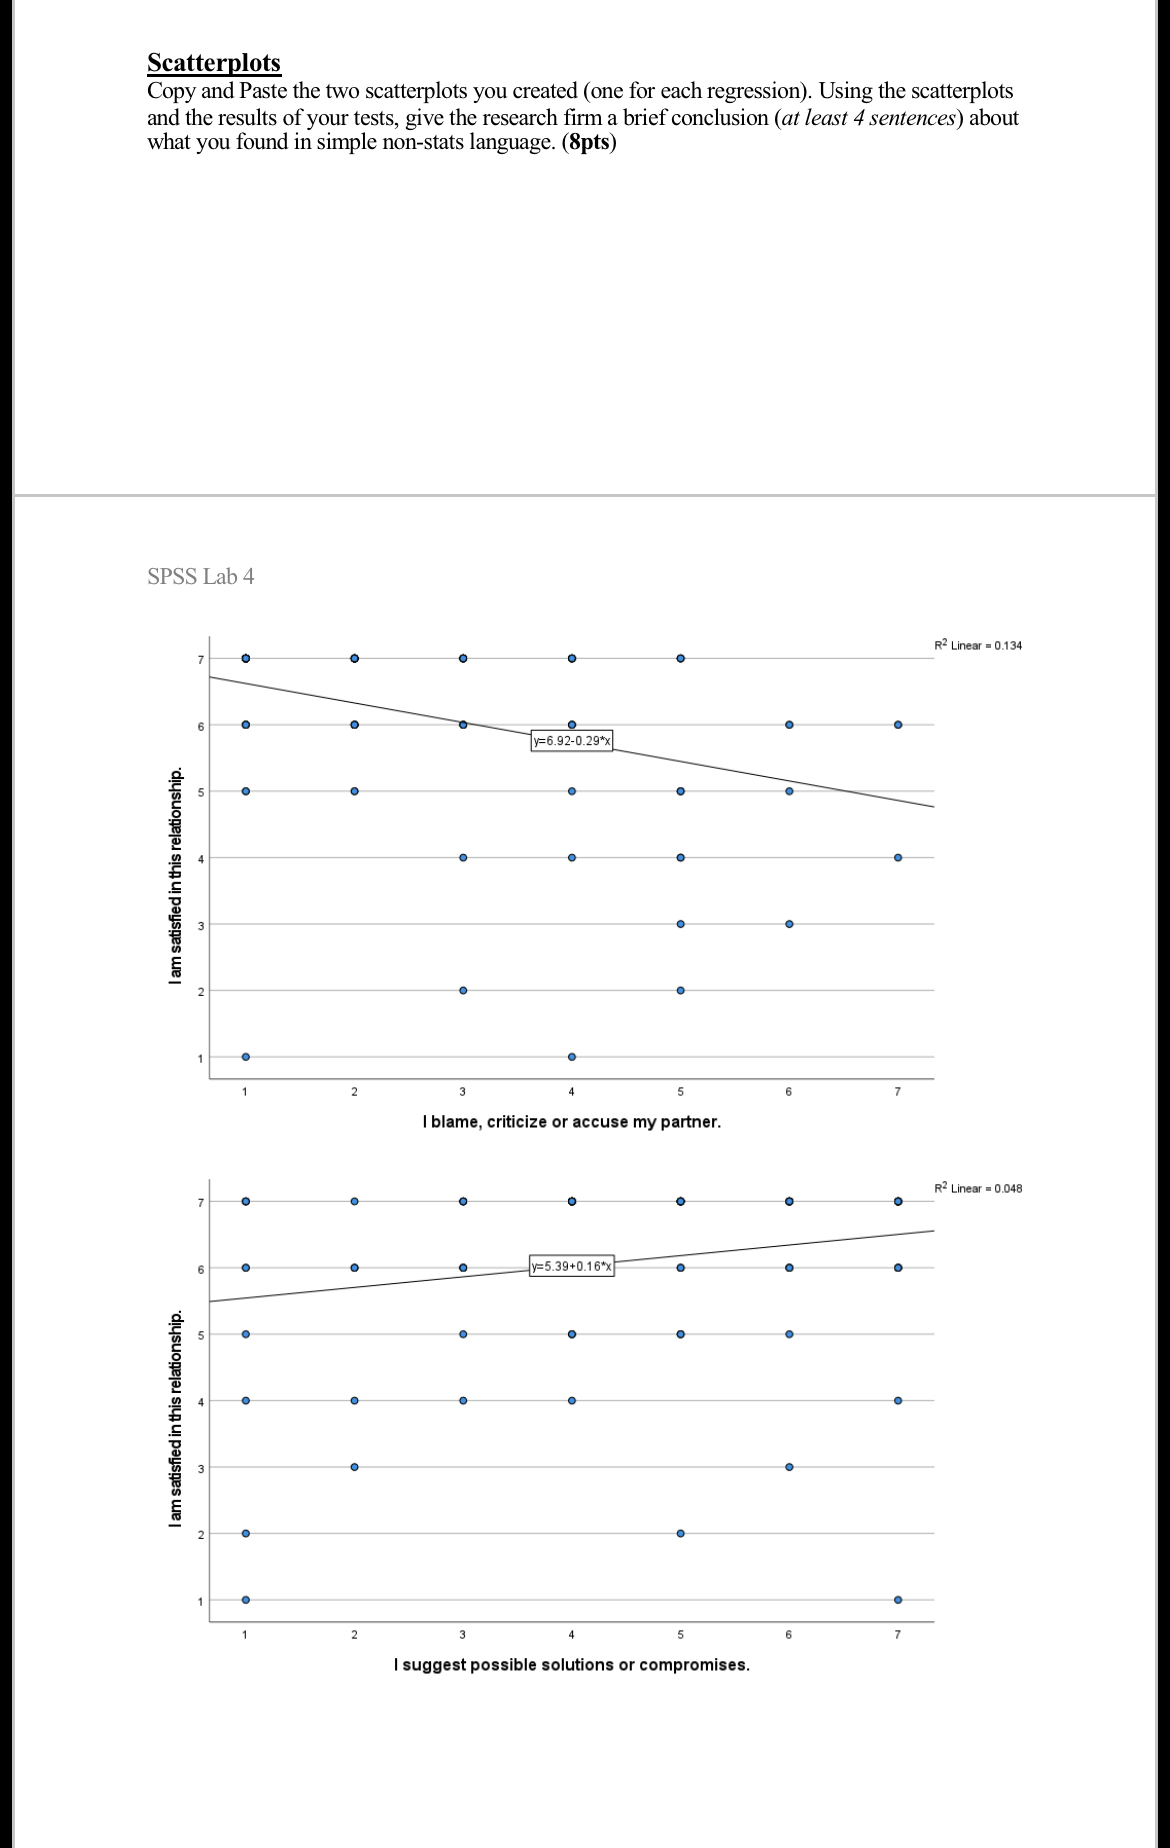
3. Using the scatterplots and results of tests, give the research a brief conclusion. (spss scatterplots can be seen in third attachment.

image text in transcribedimage text in transcribedimage text in transcribed
Your tasks: 1. Run a linear regression analysis in SPSS with 'placeblame' as your predictor variable and "rationalsatisfaction' as the criterion variable and interpret the regression coefficient. a. Create a scatterplot with the regression line for these variables 2. Run another linear regression analysis in SPSS with 'suggestsolutions' as your predictor variable and 'whationalsatisfaction' as the criterion variable and interpret your findings a. Create a scatterplot with the regression line for these variables. 3. Present your scatterplots for both tests (so 2 scatterplots) and use them to give a brief conclusion about what you found. Regression Output for 'placeblame': Copy and paste all the SPSS output boxes from your linear correlation below (3pts) Descriptive Statistics Mean Std. Deviation I am satisfied in this 6.12 1.358 100 relationship. I blame, criticize or 2.71 1.695 100 accuse my partner. Correlations I blame I am satisfied criticize or in this accuse my relationship. partner. Pearson Correlation I am satisfied in this 1.000 -.366 relationship. I blame, criticize or -.366 1.000 accuse my partner Sig. (1-tailed) I am satisfied in this <.001 relationship. i blame criticize or .000 accuse my partner. n am satisfied in this relationship spss lab variables entered model removed method enter a. dependent variable: b. all requested entered. summary adjusted r std. error of square the estimate .366 predictors: partner anova sum squares df mean sig. regression residual total coefficients standardized unstandardized b beta .240 .293 .075 raw interpretations for interpret significance coefficient and use to explain how x impacts y output copy paste boxes from your linear correlation below descriptive statistics deviation suggest possible solutions compromises correlations pearson iam compromises. .335 f sig .354 .160 .220 two scatterplots you created each using results tests give research firm a brief conclusion least sentences about what found simple non-stats language. r2 c w>

Step by Step Solution

There are 3 Steps involved in it

Step: 1

blur-text-image

Get Instant Access to Expert-Tailored Solutions

See step-by-step solutions with expert insights and AI powered tools for academic success

Step: 2

blur-text-image

Step: 3

blur-text-image

Ace Your Homework with AI

Get the answers you need in no time with our AI-driven, step-by-step assistance

Get Started

Recommended Textbook for

Trigonometry A Unit Circle Approach (Subscription)

Authors: Michael Sullivan

10th Edition

0134178785, 9780134178783

More Books

Students also viewed these Mathematics questions

Question

b. What is the persons job title?

Answered: 1 week ago