Answered step by step
Verified Expert Solution
Link Copied!

Question

1 Approved Answer

1. The temperature interval diagram for a process is shown below. For this process, do the following: Stream 1 2 3 4 5 6 HCFR
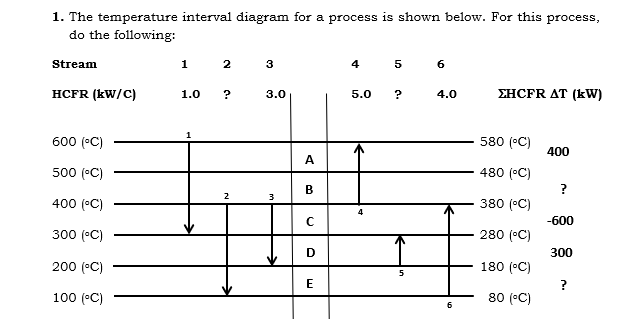
image text in transcribedimage text in transcribed

1. The temperature interval diagram for a process is shown below. For this process, do the following: Stream 1 2 3 4 5 6 HCFR (kW/C) 1.0 ? 3.0 5.0 ? 4.0 EHCFR AT (kW) 600 (C) 580 (C) 400 A 500 (C) 480 (C) B ? 2 3 400 (C) 380 (C) -600 300 (C) 280 (C) D 300 200 (C) 180 (C) 5 E ? 100 (C) 80 (C) 6 d. Calculate the minimum number of exchangers needed for the minimum energy case, for above and below the pinch. e. Draw the heat exchanger network for the process. f. Calculate the % savings for hot and cold utilities

Step by Step Solution

There are 3 Steps involved in it

Step: 1

blur-text-image

Get Instant Access to Expert-Tailored Solutions

See step-by-step solutions with expert insights and AI powered tools for academic success

Step: 2

blur-text-image_2

Step: 3

blur-text-image_3

Ace Your Homework with AI

Get the answers you need in no time with our AI-driven, step-by-step assistance

Get Started

Recommended Textbook for

Thermodynamics Concepts And Applications

Authors: Stephen R. Turns

1st Edition

0521850428, 9780521850421

More Books

Students also viewed these Chemical Engineering questions

Question

LO34.1 Identify and explain the functions of money.

Answered: 1 week ago