Answered step by step
Verified Expert Solution
Link Copied!

Question

1 Approved Answer

1. The weekly production (real data) in FarmaMed is tabulated in the following table: a. The operations manager has been asked to select one of
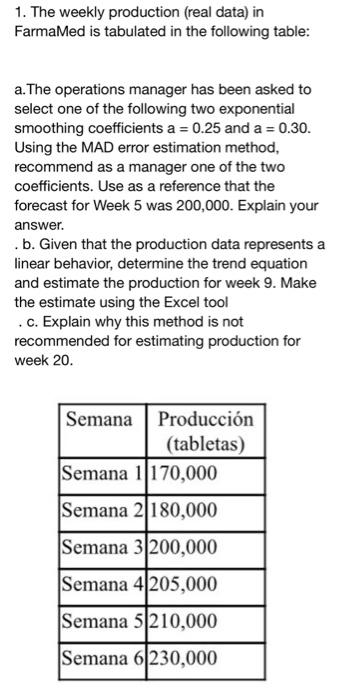
image text in transcribed
1. The weekly production (real data) in FarmaMed is tabulated in the following table: a. The operations manager has been asked to select one of the following two exponential smoothing coefficients a=0.25 and a=0.30. Using the MAD error estimation method, recommend as a manager one of the two coefficients. Use as a reference that the forecast for Week 5 was 200,000. Explain your answer. b. Given that the production data represents a linear behavior, determine the trend equation and estimate the production for week 9 . Make the estimate using the Excel tool . c. Explain why this method is not recommended for estimating production for week 20

Step by Step Solution

There are 3 Steps involved in it

Step: 1

blur-text-image

Get Instant Access to Expert-Tailored Solutions

See step-by-step solutions with expert insights and AI powered tools for academic success

Step: 2

blur-text-image

Step: 3

blur-text-image

Ace Your Homework with AI

Get the answers you need in no time with our AI-driven, step-by-step assistance

Get Started

Recommended Textbook for

Supervision Today

Authors: Stephen P. Robbins, David A. DeCenzo, Robert M. Wolter

8th edition

133884869, 133884864, 978-0133884869

More Books

Students also viewed these General Management questions