Answered step by step
Verified Expert Solution
Link Copied!

Question

1 Approved Answer

1. There are two groups: 'Those who have a car and Those who do not have a car. If you were asked the question on

1. There are two groups: 'Those who have a car" and "Those who do not have a car". If you were asked the question on greatest distance: In that data set (for the group you would belong to (own carot own car)), I guess that my z-score would be about ___________.

Determine what group you are in? the "car" group or the "no car" group?

Then decide what YOUR distance value would be expressed as a Z score. Base this Z score on the the percentage of students in your group that you believe would have a distance value less than your value.

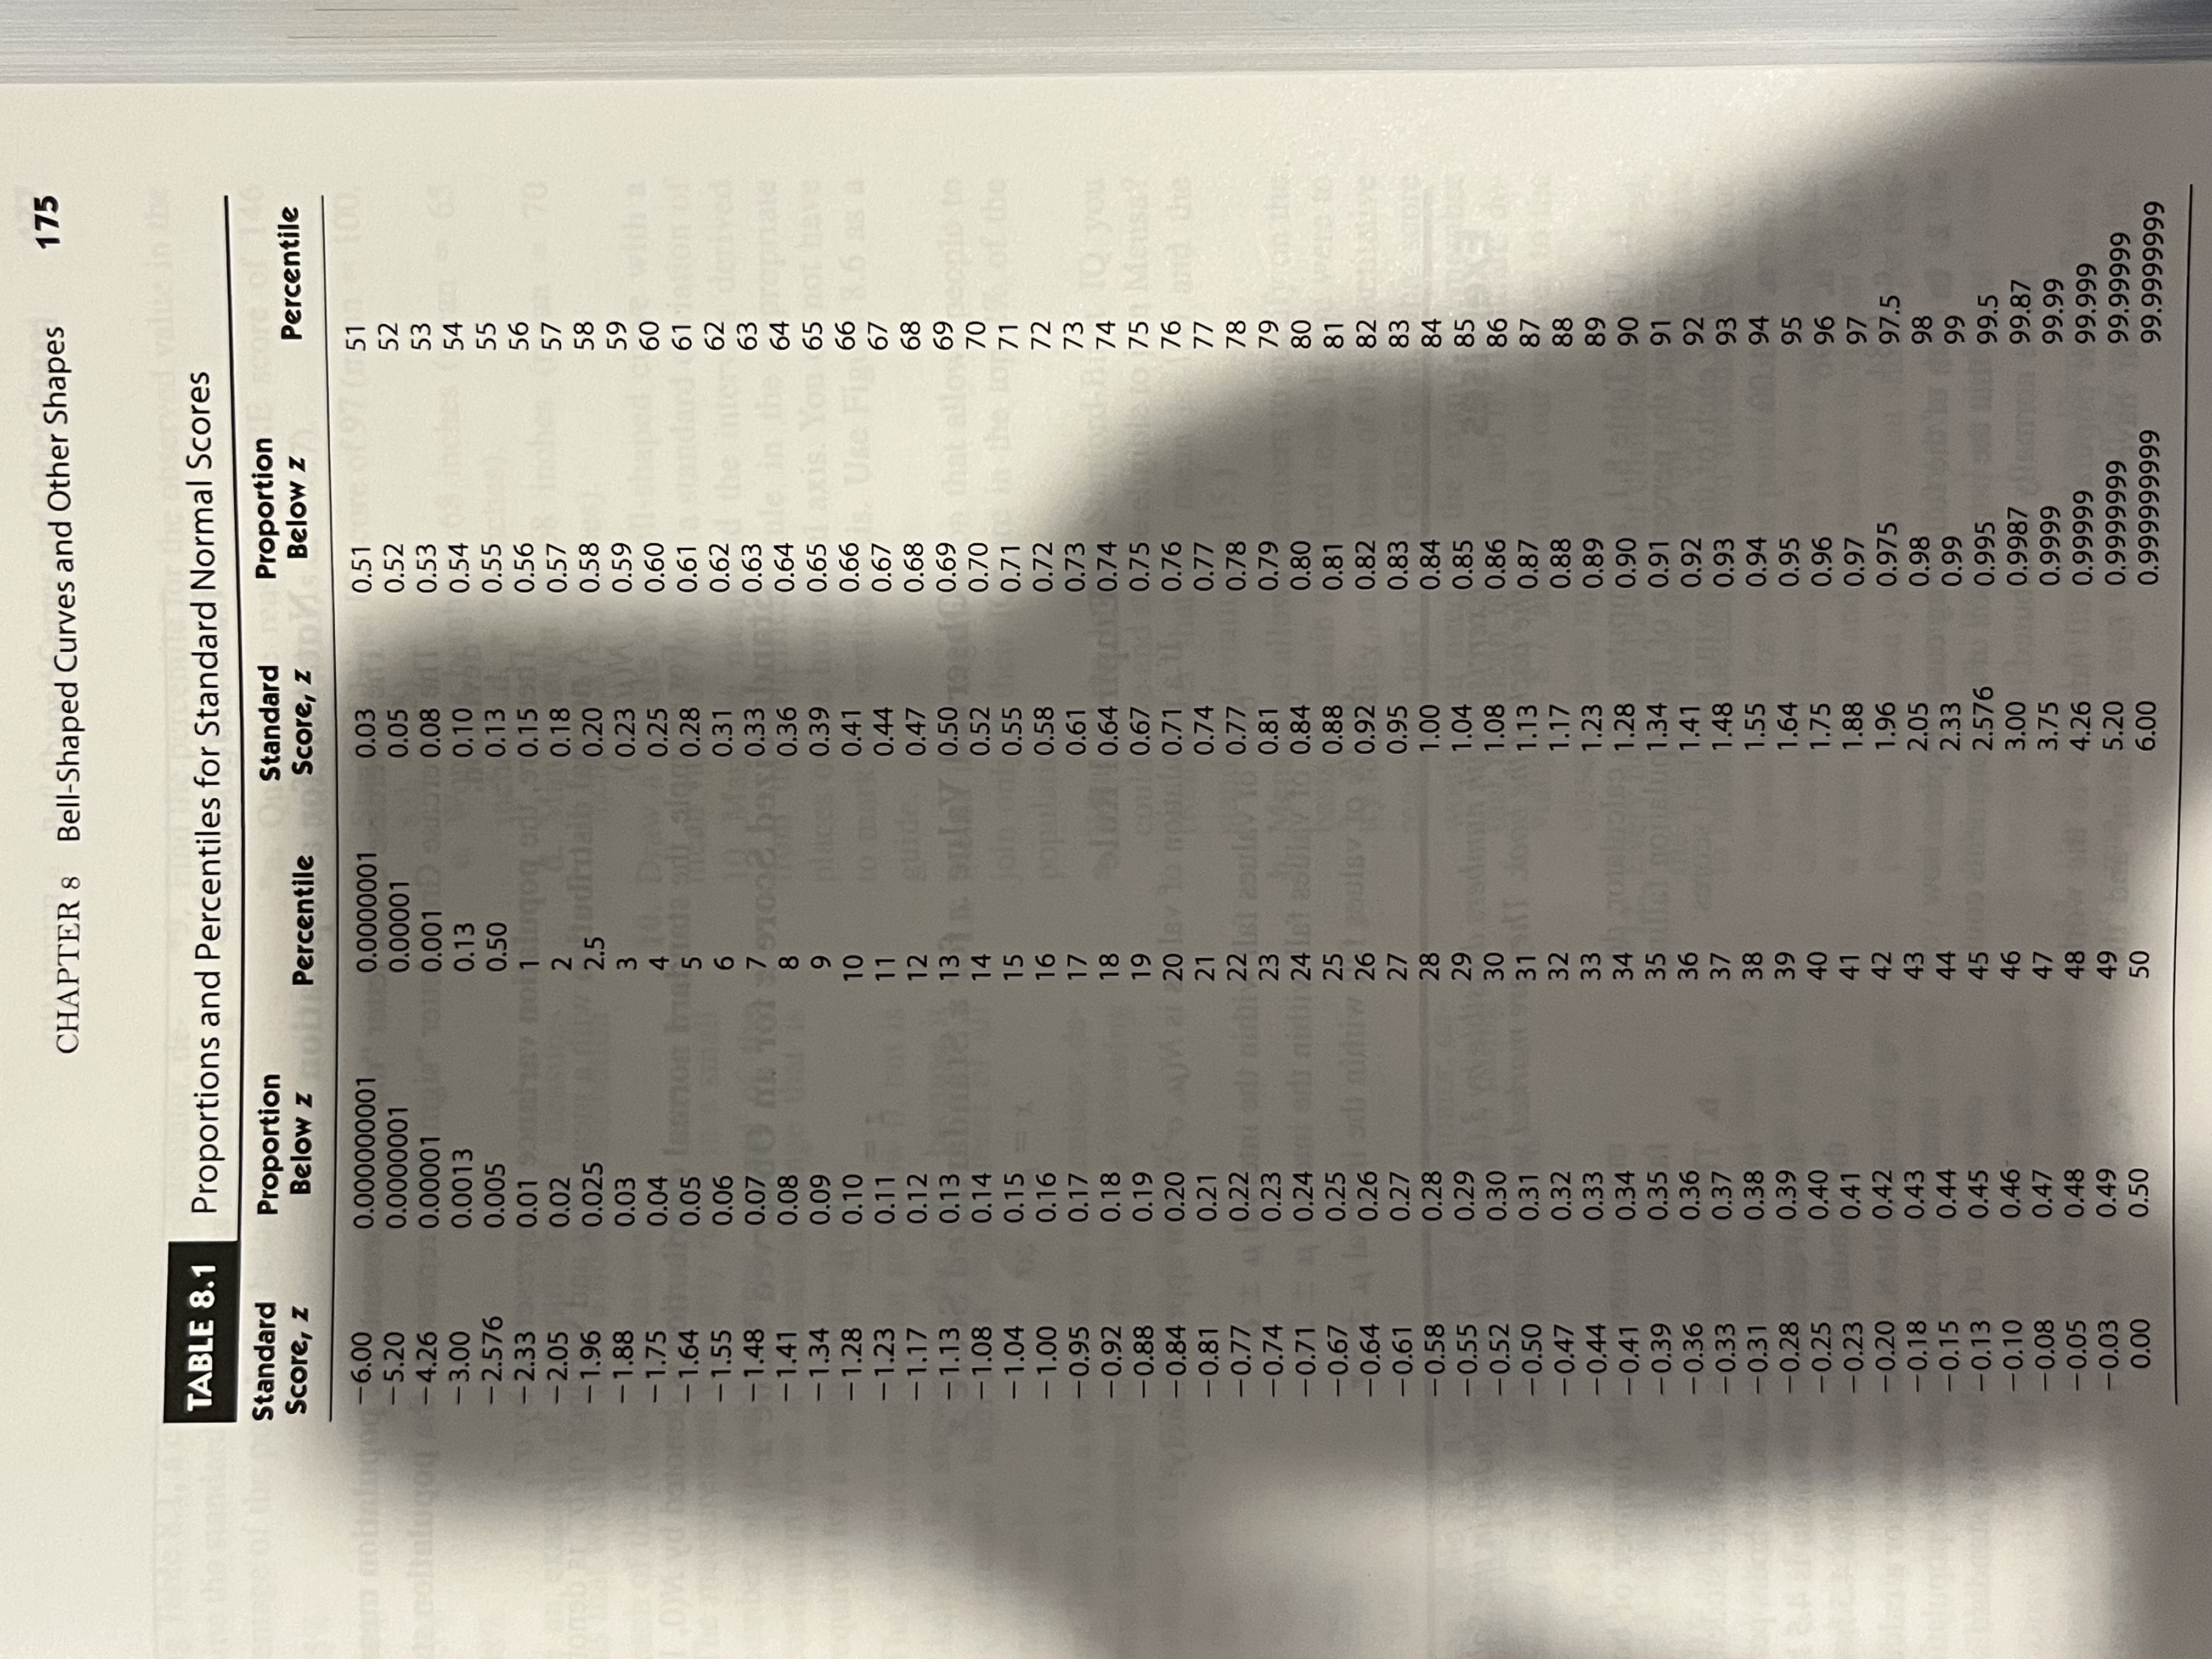
You need to look at the 'percentile' column in Table 8.1 in the text to determine your Z score since the percentile column represents the percentage of Z values below a particular Z and this percentile then corresponds to the percentage of distance values below a particular distance value.

FOR THIS EXERCISE, WE ASSUME THE DATA WILL BE NORMALLY DISTRIBUTED (BELL-SHAPED) ALTHOUGH IT ACTUALLY IS NOT, SINCE WE USE THE Z TABLE WITH NORMALLY DISTRIBUTED DATA.

2. The reasoning behind my guess is (explain the logic behind choosing the percentile you used to determine your Z):

This is the table mentioned:

image text in transcribed
CHAPTER 8 Bell-Shaped Curves and Other Shapes 175 values TABLE 8.1 Proportions and Percentiles for Standard Normal Scores Standard Proportion Standard Proportion Score, z Below z Percentile Score, z Below z Percentile -6.00 0.000000001 0.0000001 0.03 0.51 51 -5.20 0.0000001 0.00001 0.05 0.52 52 pollalugod -4.26 0.00001 0.001 0.08 0.53 53 -3.00 0.0013 0.13 0.10 0.54 54 -2.576 0.005 0.50 0.13 0.55 55 - 2.33 0.01 0.15 0.56 56 -2.05 0.02 2 0.18 0.57 57 - 1.96 0.025 2.5 0.20 0.58 58 - 1.88 0.03 3 0.23 0.59 59 -1.75 0.04 0.25 0.60 60 -1.64 0.05 0.28 0.61 61 -1.55 0.06 6 0.31 0.62 62 - 1.48 0.07 193030 9 0.33 0.63 63 -1.41 0.08 8 0.36 0.64 64 - 1.34 0.09 0.39 0.65 axis. You 65 - 1.28 0.10 10 0.41 0.66 Use 66 - 1.23 0.11 11 0.44 0.67 67 -1.17 0.12 12 guide 0.47 0.68 68 -1.13 0.13 13 0.50 0.69 that allo 69 -1.08 0.14 14 0.52 0.70 70 - 1.04 0.15 15 0.55 0.71 71 -1.00 0.16 16 popul 0.58 0.72 72 -0.95 0.17 17 0.61 0.73 73 -0.92 0.18 18 0.64 0.74 74 TO you -0.88 0.19 19 Cou 0.67 0.75 75 Mensa? -0.84 0.20 O lav 10 mode 0.71 0.76 76 -0.81 0.21 21 0.74 0.77 77 -0.77 0.22 0.77 0.78 78 -0.74 0.23 23 0.81 0.79 24 1 250 79 -0.71 0.24 0.84 0.80 80 -0.67 0.25 25 0.88 0.81 81 -0.64 0.26 26 0.92 0.82 82 -0.61 0.27 27 0.95 0.83 83 -0.58 0.28 28 1.00 0.84 84 -0.55 0.29 29 1.04 0.85 85 -0.52 0.30 30 1.08 0.86 -0.50 0.31 37 86 1.13 0.87 87 -0.47 0.32 32 1.17 0.88 88 -0.44 0.33 33 1.23 0.89 89 -0.41 0.34 34 1.28 0.90 90 -0.39 0.35 35 1.34 0.91 91 -0.36 0.36 36 1.41 0.92 92 -0.33 0.37 37 1.48 0.93 93 -0.31 0.38 38 1.55 0.94 94 -0.28 0.39 39 1.64 0.95 95 -0.25 0.40 40 1.75 0.96 96 -0.23 0.41 41 1.88 0.97 97 -0.20 0.42 42 1.96 0.975 97.5 -0.18 0.43 43 2.05 0.98 98 -0.15 0.44 44 2.33 0.99 99 -0.13 0.45 45 2.576 0.995 99.5 -0.10 0.46 46 3.00 0.9987 99.87 -0.08 0.47 47 3.75 0.9999 0.48 99.99 -0.05 48 4.26 0.99999 99.999 -0.03 0.49 49 5.20 0.00 0.50 50 0.9999999 99.99999 6.00 0.999999999 99.9999999

Step by Step Solution

There are 3 Steps involved in it

Step: 1

blur-text-image

Get Instant Access to Expert-Tailored Solutions

See step-by-step solutions with expert insights and AI powered tools for academic success

Step: 2

blur-text-image

Step: 3

blur-text-image

Ace Your Homework with AI

Get the answers you need in no time with our AI-driven, step-by-step assistance

Get Started

Recommended Textbook for

Probability With Applications and R

Authors: Robert P. Dobrow

1st edition

1118241257, 1118241258, 978-1118241257

More Books

Students also viewed these Mathematics questions