Question
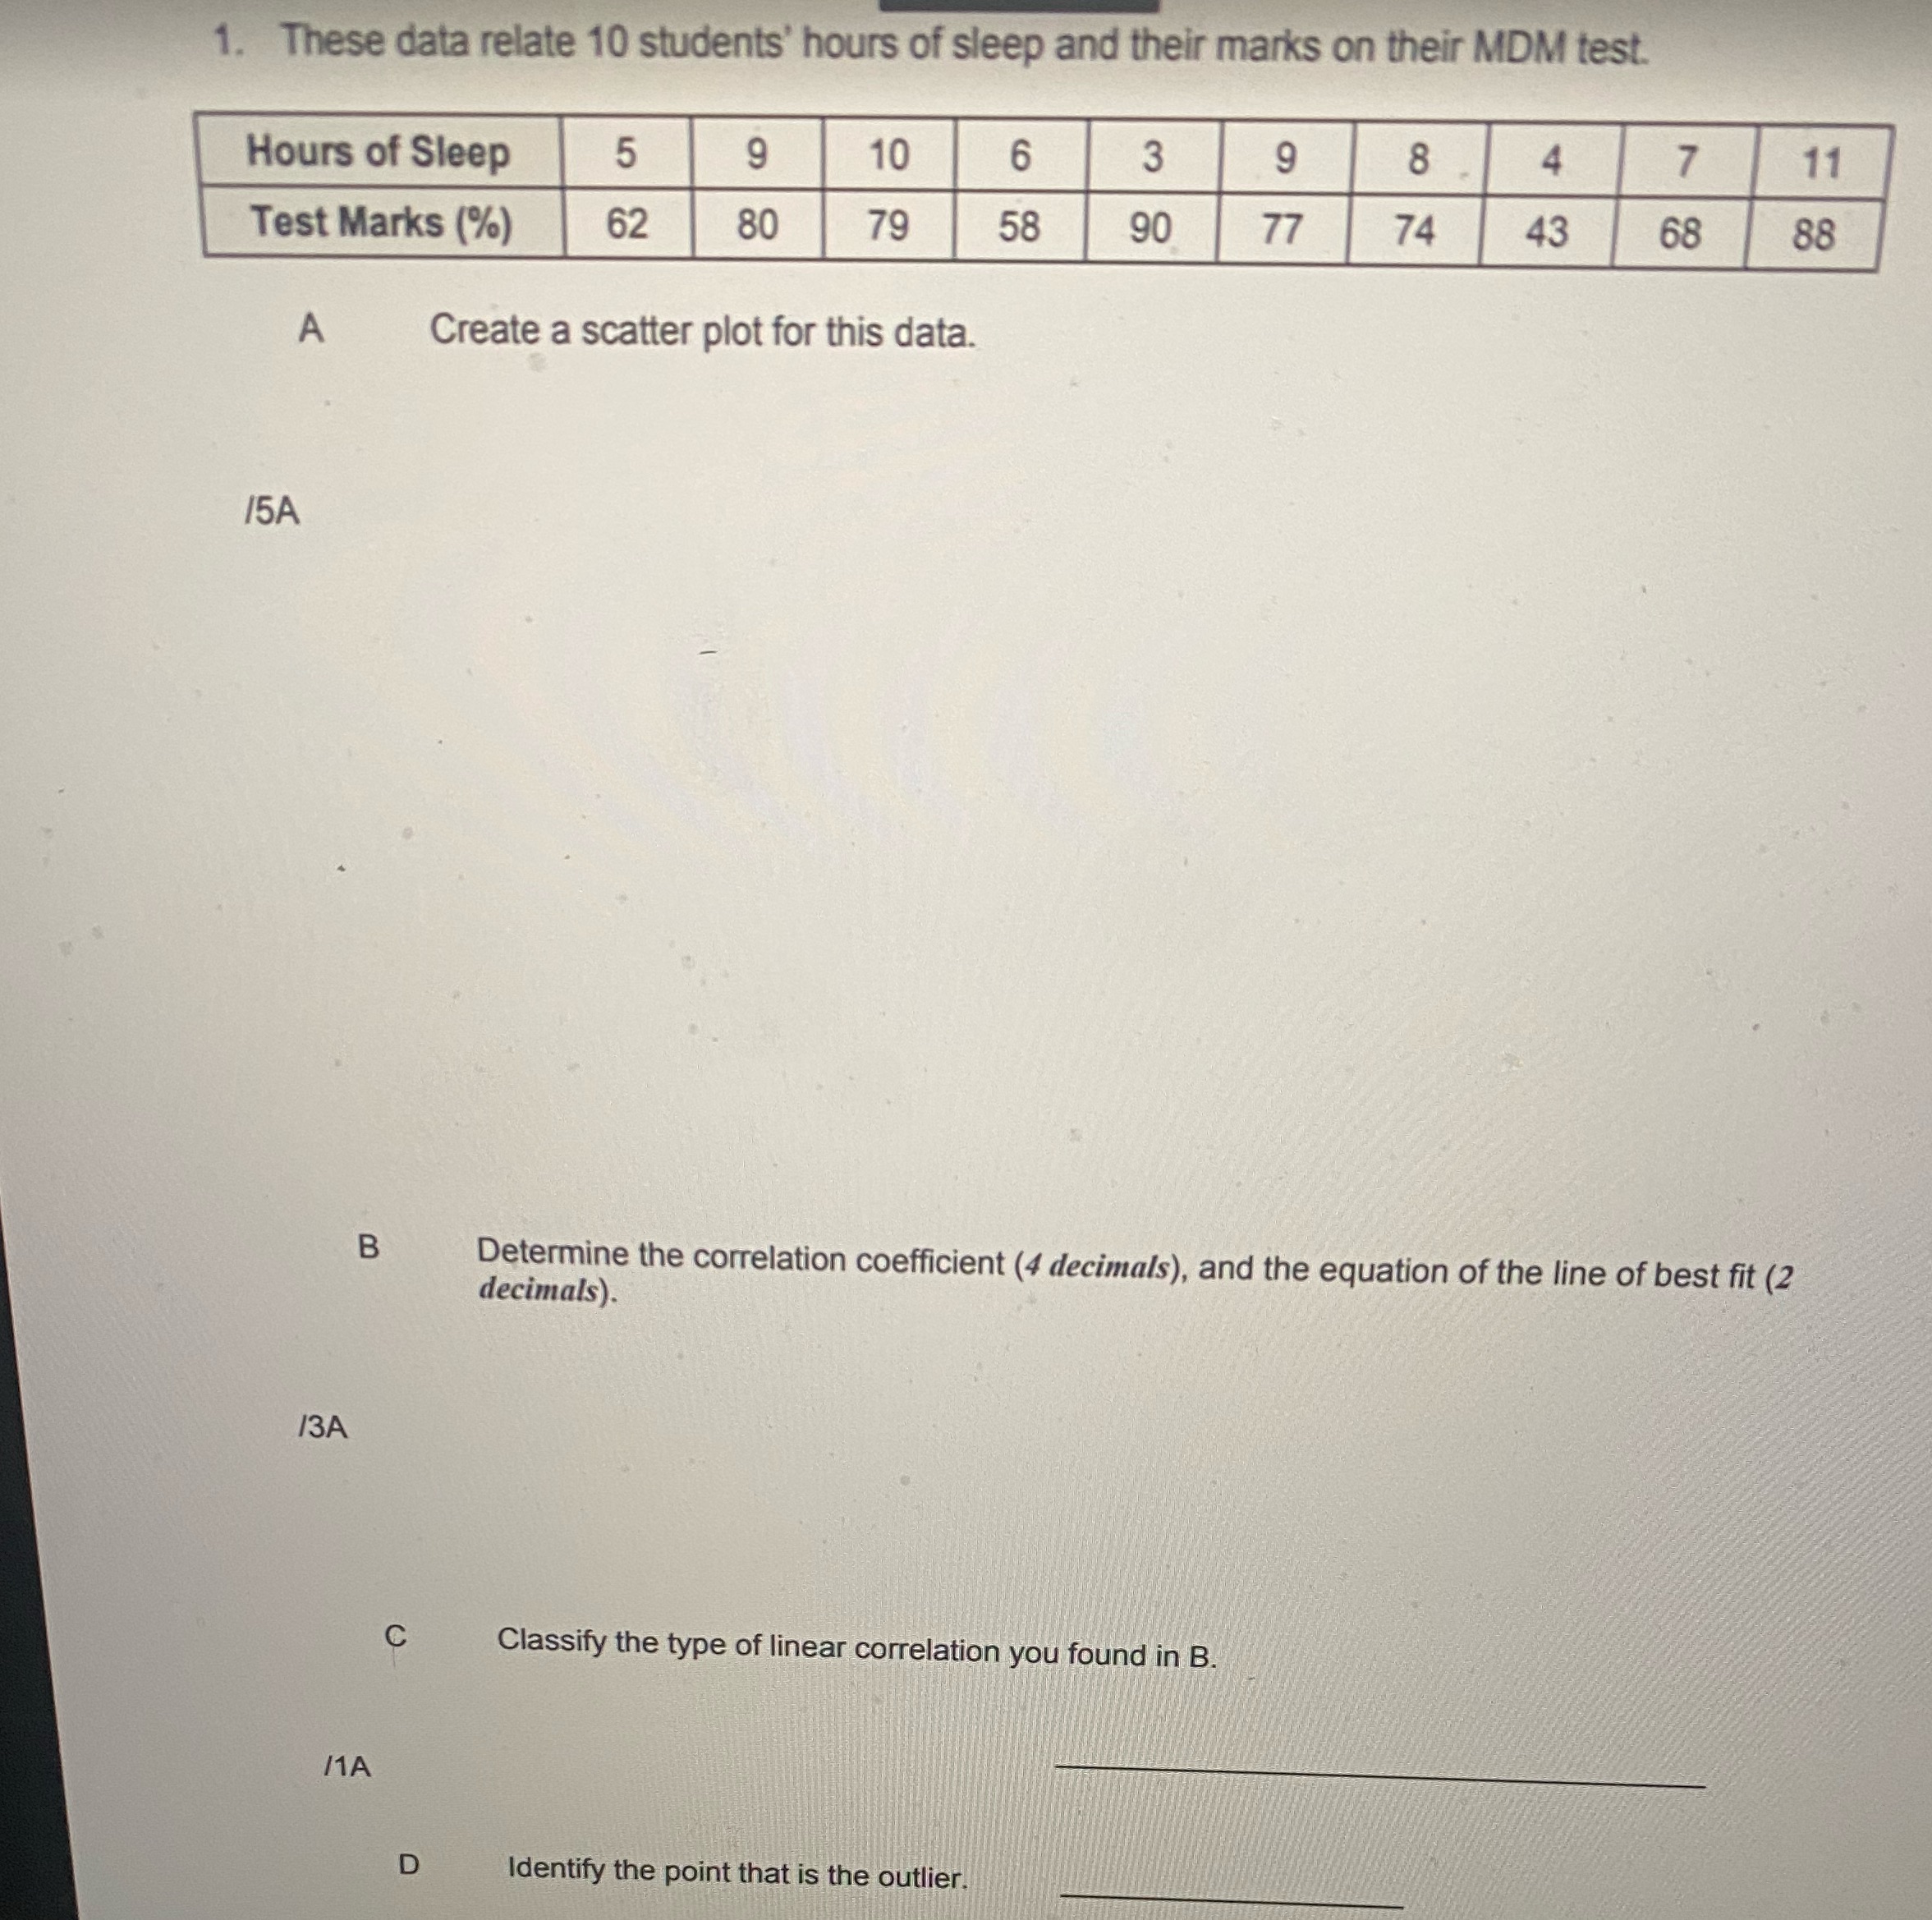
1. These data relate 10 students' hours of sleep and their marks on their MDM test. Hours of Sleep 5 9 10 6 3

1. These data relate 10 students' hours of sleep and their marks on their MDM test. Hours of Sleep 5 9 10 6 3 9 8 4 7 11 Test Marks (%) 62 80 79 58 90 77 74 43 68 88 A Create a scatter plot for this data. 15A 13A B /1A C Determine the correlation coefficient (4 decimals), and the equation of the line of best fit (2 decimals). Classify the type of linear correlation you found in B. D Identify the point that is the outlier.
Step by Step Solution
There are 3 Steps involved in it
Step: 1

Get Instant Access to Expert-Tailored Solutions
See step-by-step solutions with expert insights and AI powered tools for academic success
Step: 2

Step: 3

Ace Your Homework with AI
Get the answers you need in no time with our AI-driven, step-by-step assistance
Get StartedRecommended Textbook for
Statistics
Authors: Robert S. Witte, John S. Witte
11th Edition
1119254515, 978-1119254515
Students also viewed these Mathematics questions
Question
Answered: 1 week ago
Question
Answered: 1 week ago
Question
Answered: 1 week ago
Question
Answered: 1 week ago
Question
Answered: 1 week ago
Question
Answered: 1 week ago
Question
Answered: 1 week ago
Question
Answered: 1 week ago
Question
Answered: 1 week ago
Question
Answered: 1 week ago
Question
Answered: 1 week ago
Question
Answered: 1 week ago
Question
Answered: 1 week ago
Question
Answered: 1 week ago
Question
Answered: 1 week ago
Question
Answered: 1 week ago
Question
Answered: 1 week ago
Question
Answered: 1 week ago
Question
Answered: 1 week ago
Question
Answered: 1 week ago
Question
Answered: 1 week ago
Question
Answered: 1 week ago
View Answer in SolutionInn App


