

Answered step by step
Verified Expert Solution
Question
1 Approved Answer
1). This Graph plots a data series (blue line), M1 money stock divided by the monetsry base and Bank Reserve Balances (green line), from 2004
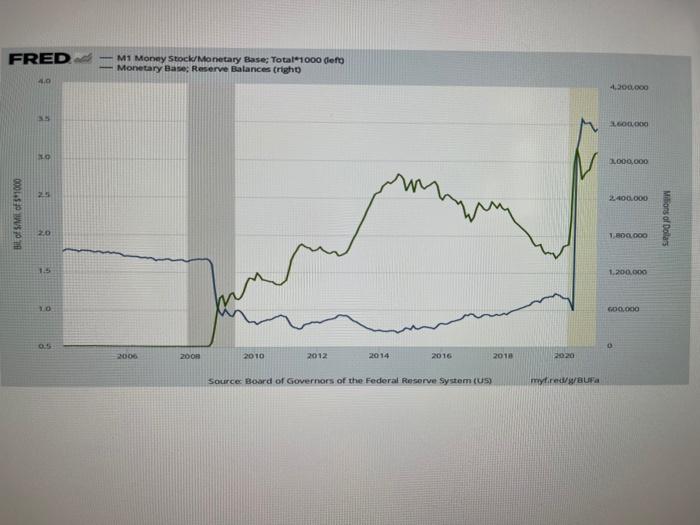
1). This Graph plots a data series (blue line), M1 money stock divided by the monetsry base and Bank Reserve Balances (green line), from 2004 to 2021.
A). what does the series showing M1 money stock divided by the monetary base measure?
B). how are bank reserve balances related to this measure?
Step by Step Solution
There are 3 Steps involved in it
Step: 1

Get Instant Access to Expert-Tailored Solutions
See step-by-step solutions with expert insights and AI powered tools for academic success
Step: 2

Step: 3
Ace Your Homework with AI
Get the answers you need in no time with our AI-driven, step-by-step assistance
Get Started
Personal Finance For Dummies
Authors: Eric Tyson
5th Edition
0470038322, 978-0470038321