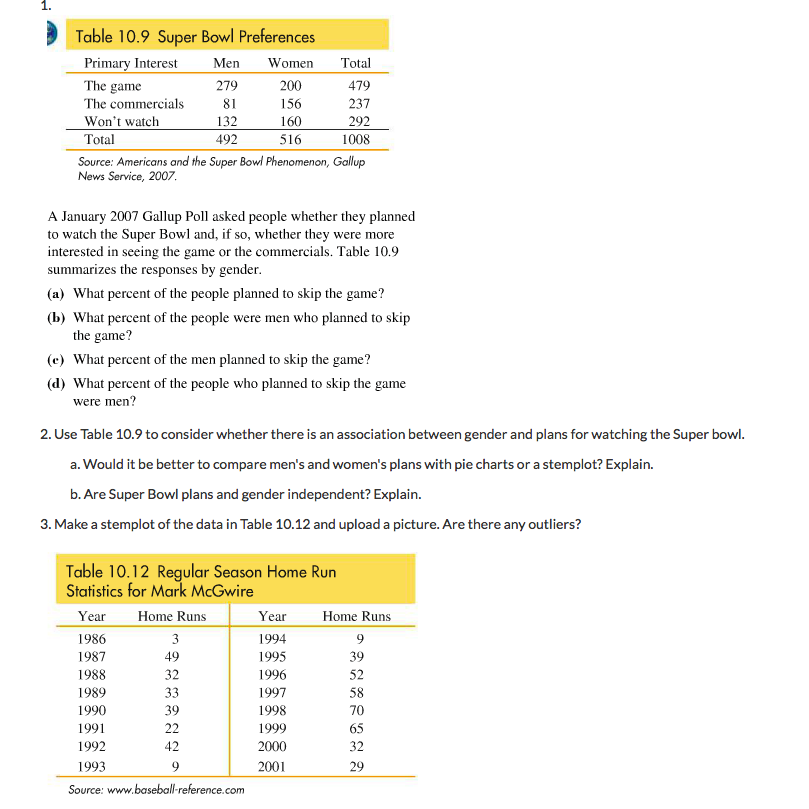
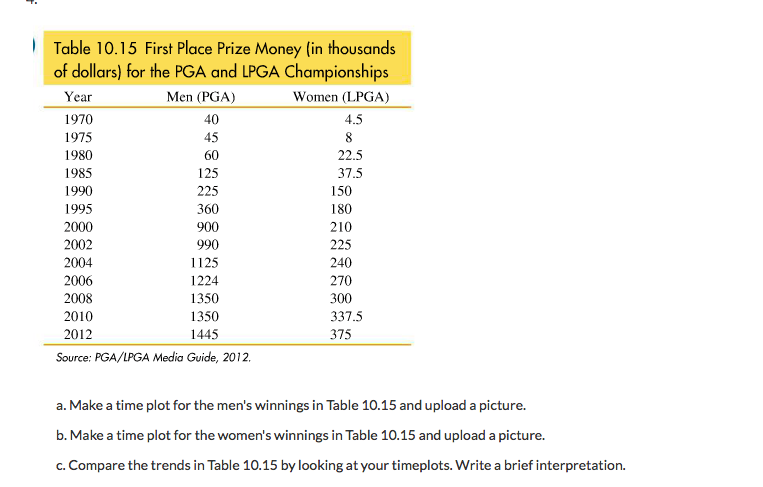
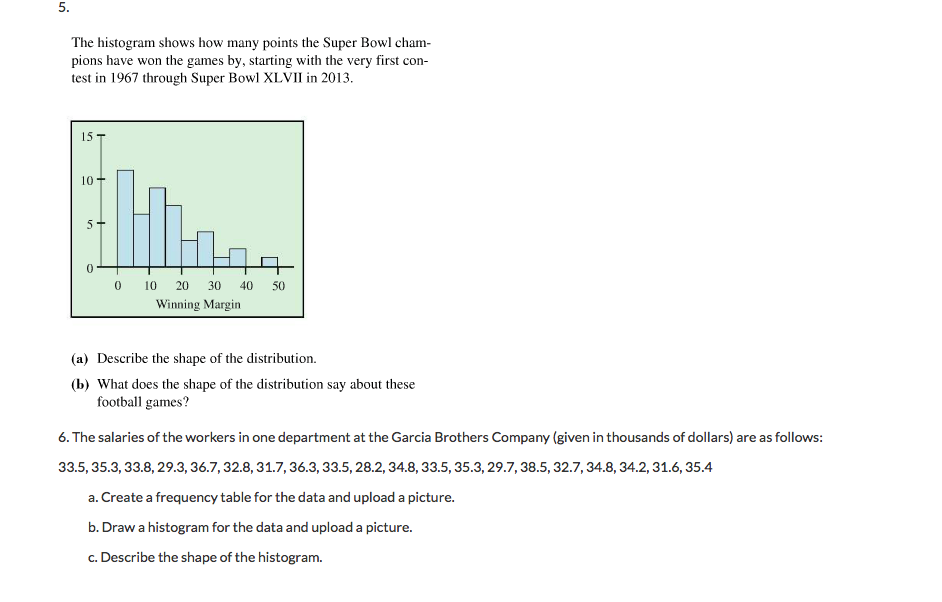
1 ' Tobie 10.? Super Emmi Preferences Primary Interest Men Women Total The game 2'19 200 419 The commercials 81 [56 237 Wonk watch I32 [60 292 Total 492 516 10118 Source: Americans and the Super Bowl Phenomenon, Gallup New Seneca, 200?. A January Ztl'i' Gallup Poll asked people whether they planned to watch the Super Bowl and, if so, whether they were more interested in seeing the game or the commercials. Table 10.9 summarizes the responses by gender. {:1} What percent of the people planned to skip the game? {13} What percent of the people were men who planned to skip the game?r {e} What percent of the men planned to skip the game? {d} What percent of the people who planned to skip the game were men'ir 2. Use Table 10.9 to considerwhether there is an association between gender and plans forwatehing the Super bowl. a. led it be betterto compare men's and women's planswith pie charts or a stamp-lot? Explain. b. Are Super Bowl plans and gender independent? Explain. 3. Make a stemle of the data in Table 10.12 and upload a piotu re. Are there any outliers? Tobie 10.12 ulor Season Home Run Statistics For Mar McGwire Year Home Runs Year Home Runs 1936 3 [994 9 1931' 49 I995 39 1933 32 I996 52 1939 33 I99? 53 19911 39 [993 TI] 199l 22 I999 65 1992 42 2000 32 1993 9 2001 29 Scuttle: wwbasebalirel'ereneemem l Table 10.15 First Place Prize Money [in il'lausands of dollarsl for the PGA and LPG-A Championships Year Men {PEA} Women {LP-GA} l9? 0 40 4.5 [9'15 45 3 [930 00 22.5 [935 125 315 [990 225 150 [995 300 130 2000 900 210 2002 990 225 2004 l 125 240 2006 [224 2'30 2003 I350 300 2010 I350 337.5 2012 I445 3T5 Saute: FGAXLFGA Media Guide, 2012. a. Make a time plat far the me n's winnings in Table 1:115 and upload a picture. b. Make a time plat far the women's winnings in Table 10.15 and upload a picture. c. Compare the trends in Table 10.15 by leaking at your timeplats. Write a brief interpretation. The histogram shows how mam)I points. the Super Bowl cham- pions have won the games by, starting with the very rst can test in [967 through Super Bowl XLVII in 2013. {:1} Describe the shape of the distribution. {In} What does the shape of the distribution say about these football games? 6. The salaries of the workers in one department at the Garcia Brothers Companyr {given in thousands of dollars} are as follows: 33.5. 35.3, 33.8.. 29.3. 36.7, 32.8.. 31.7, 36.3.. 33.5. 28.2, 34.8.. 33.5. 35.3, 295'. 38.5, 32.7.. 34.8. 34.2, 31.6.. 35.4 a. Create a frequency table for the data and upload a picture. I). Draw a histogram for the data and upload a picture. c. Describe the shape of the histogram