Question
1. Two sets of samples are taken from a production line with the following statistics: Set 1 48.2 Set 2 40.5 68.3 52.1 62.1

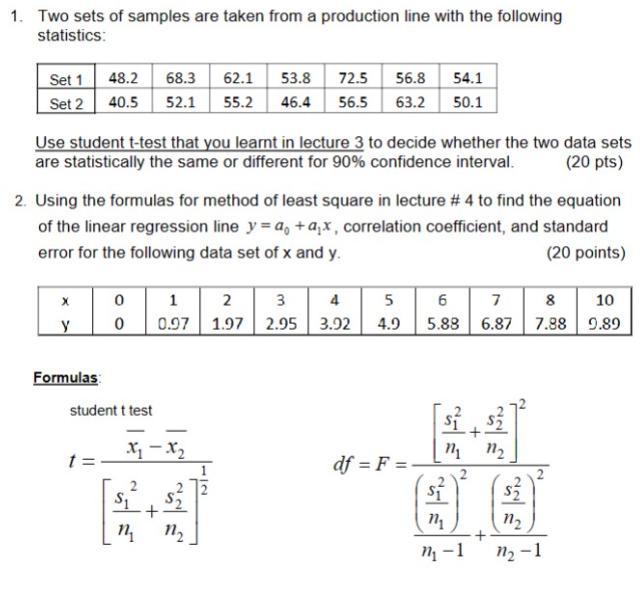
1. Two sets of samples are taken from a production line with the following statistics: Set 1 48.2 Set 2 40.5 68.3 52.1 62.1 55.2 53.8 72.5 56.8 46.4 56.5 63.2 54.1 50.1 Use student t-test that you learnt in lecture 3 to decide whether the two data sets are statistically the same or different for 90% confidence interval. (20 pts) 2. Using the formulas for method of least square in lecture # 4 to find the equation of the linear regression line y=a, +ax, correlation coefficient, and standard error for the following data set of x and y. (20 points) x 0 1 2 3 4 5 6 7 8 10 y 0 0.97 1.97 2.95 3.92 4.9 5.88 6.87 7.88 9.89 Formulas student t test si x-x2 1 12 df=F= + n, 2 m 12 + m-1 n-1
Step by Step Solution
There are 3 Steps involved in it
Step: 1

Get Instant Access to Expert-Tailored Solutions
See step-by-step solutions with expert insights and AI powered tools for academic success
Step: 2

Step: 3

Ace Your Homework with AI
Get the answers you need in no time with our AI-driven, step-by-step assistance
Get StartedRecommended Textbook for
Quality Inspired Management The Key to Sustainability
Authors: Harold Aikens
1st edition
131197568, 978-0131197565
Students also viewed these Mechanical Engineering questions
Question
Answered: 1 week ago
Question
Answered: 1 week ago
Question
Answered: 1 week ago
Question
Answered: 1 week ago
Question
Answered: 1 week ago
Question
Answered: 1 week ago
Question
Answered: 1 week ago
Question
Answered: 1 week ago
Question
Answered: 1 week ago
Question
Answered: 1 week ago
Question
Answered: 1 week ago
Question
Answered: 1 week ago
Question
Answered: 1 week ago
Question
Answered: 1 week ago
Question
Answered: 1 week ago
Question
Answered: 1 week ago
Question
Answered: 1 week ago
Question
Answered: 1 week ago
Question
Answered: 1 week ago
Question
Answered: 1 week ago
Question
Answered: 1 week ago
Question
Answered: 1 week ago
Question
Answered: 1 week ago
View Answer in SolutionInn App


