

Question: 1. Two signals, x, (t) and x(t), are defined as follows, 1 x (t) = 2 0 x (t) 2 and are shown in
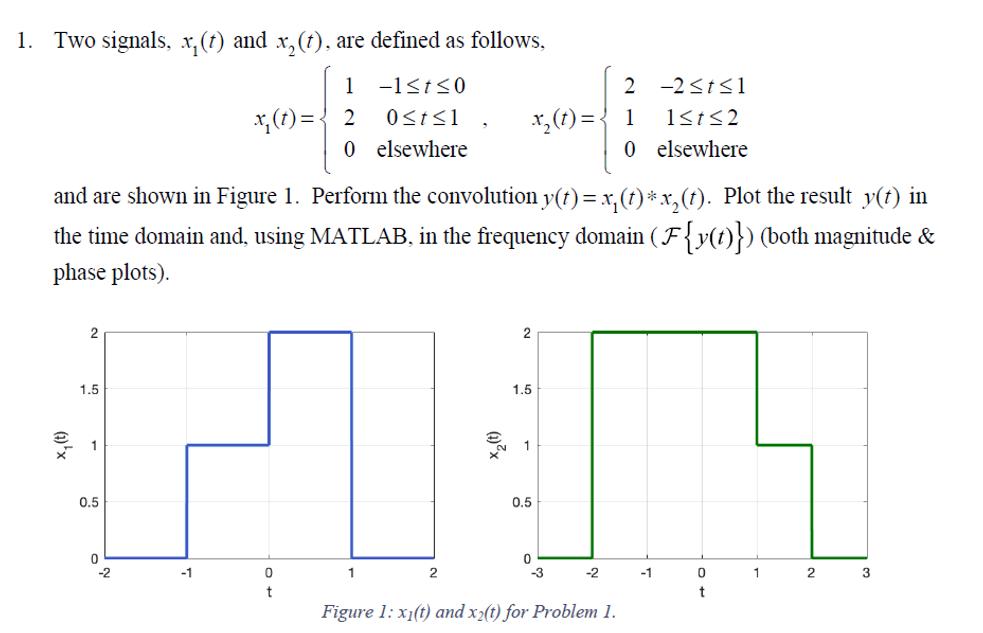
1. Two signals, x, (t) and x(t), are defined as follows, 1 x (t) = 2 0 x (t) 2 and are shown in Figure 1. Perform the convolution y(t) = x(t)*x(t). Plot the result y(t) in the time domain and, using MATLAB, in the frequency domain (F{y(t)}) (both magnitude & phase plots). 1.5 1 0.5 0 0 t -1t0 0t1 elsewhere 1 2 (1) x x (t) = 1 2 1.5 1 0.5 0 -3 2 -2 t1 1t2 0 elsewhere -2 Figure 1: x1(t) and x2(t) for Problem 1. -1 0 t 1 2 3
Step by Step Solution
★★★★★
3.46 Rating (169 Votes )
There are 3 Steps involved in it
1 Expert Approved Answer
Step: 1 Unlock

Question Has Been Solved by an Expert!
Get step-by-step solutions from verified subject matter experts
Step: 2 Unlock
Step: 3 Unlock