

Answered step by step
Verified Expert Solution
Question
1 Approved Answer
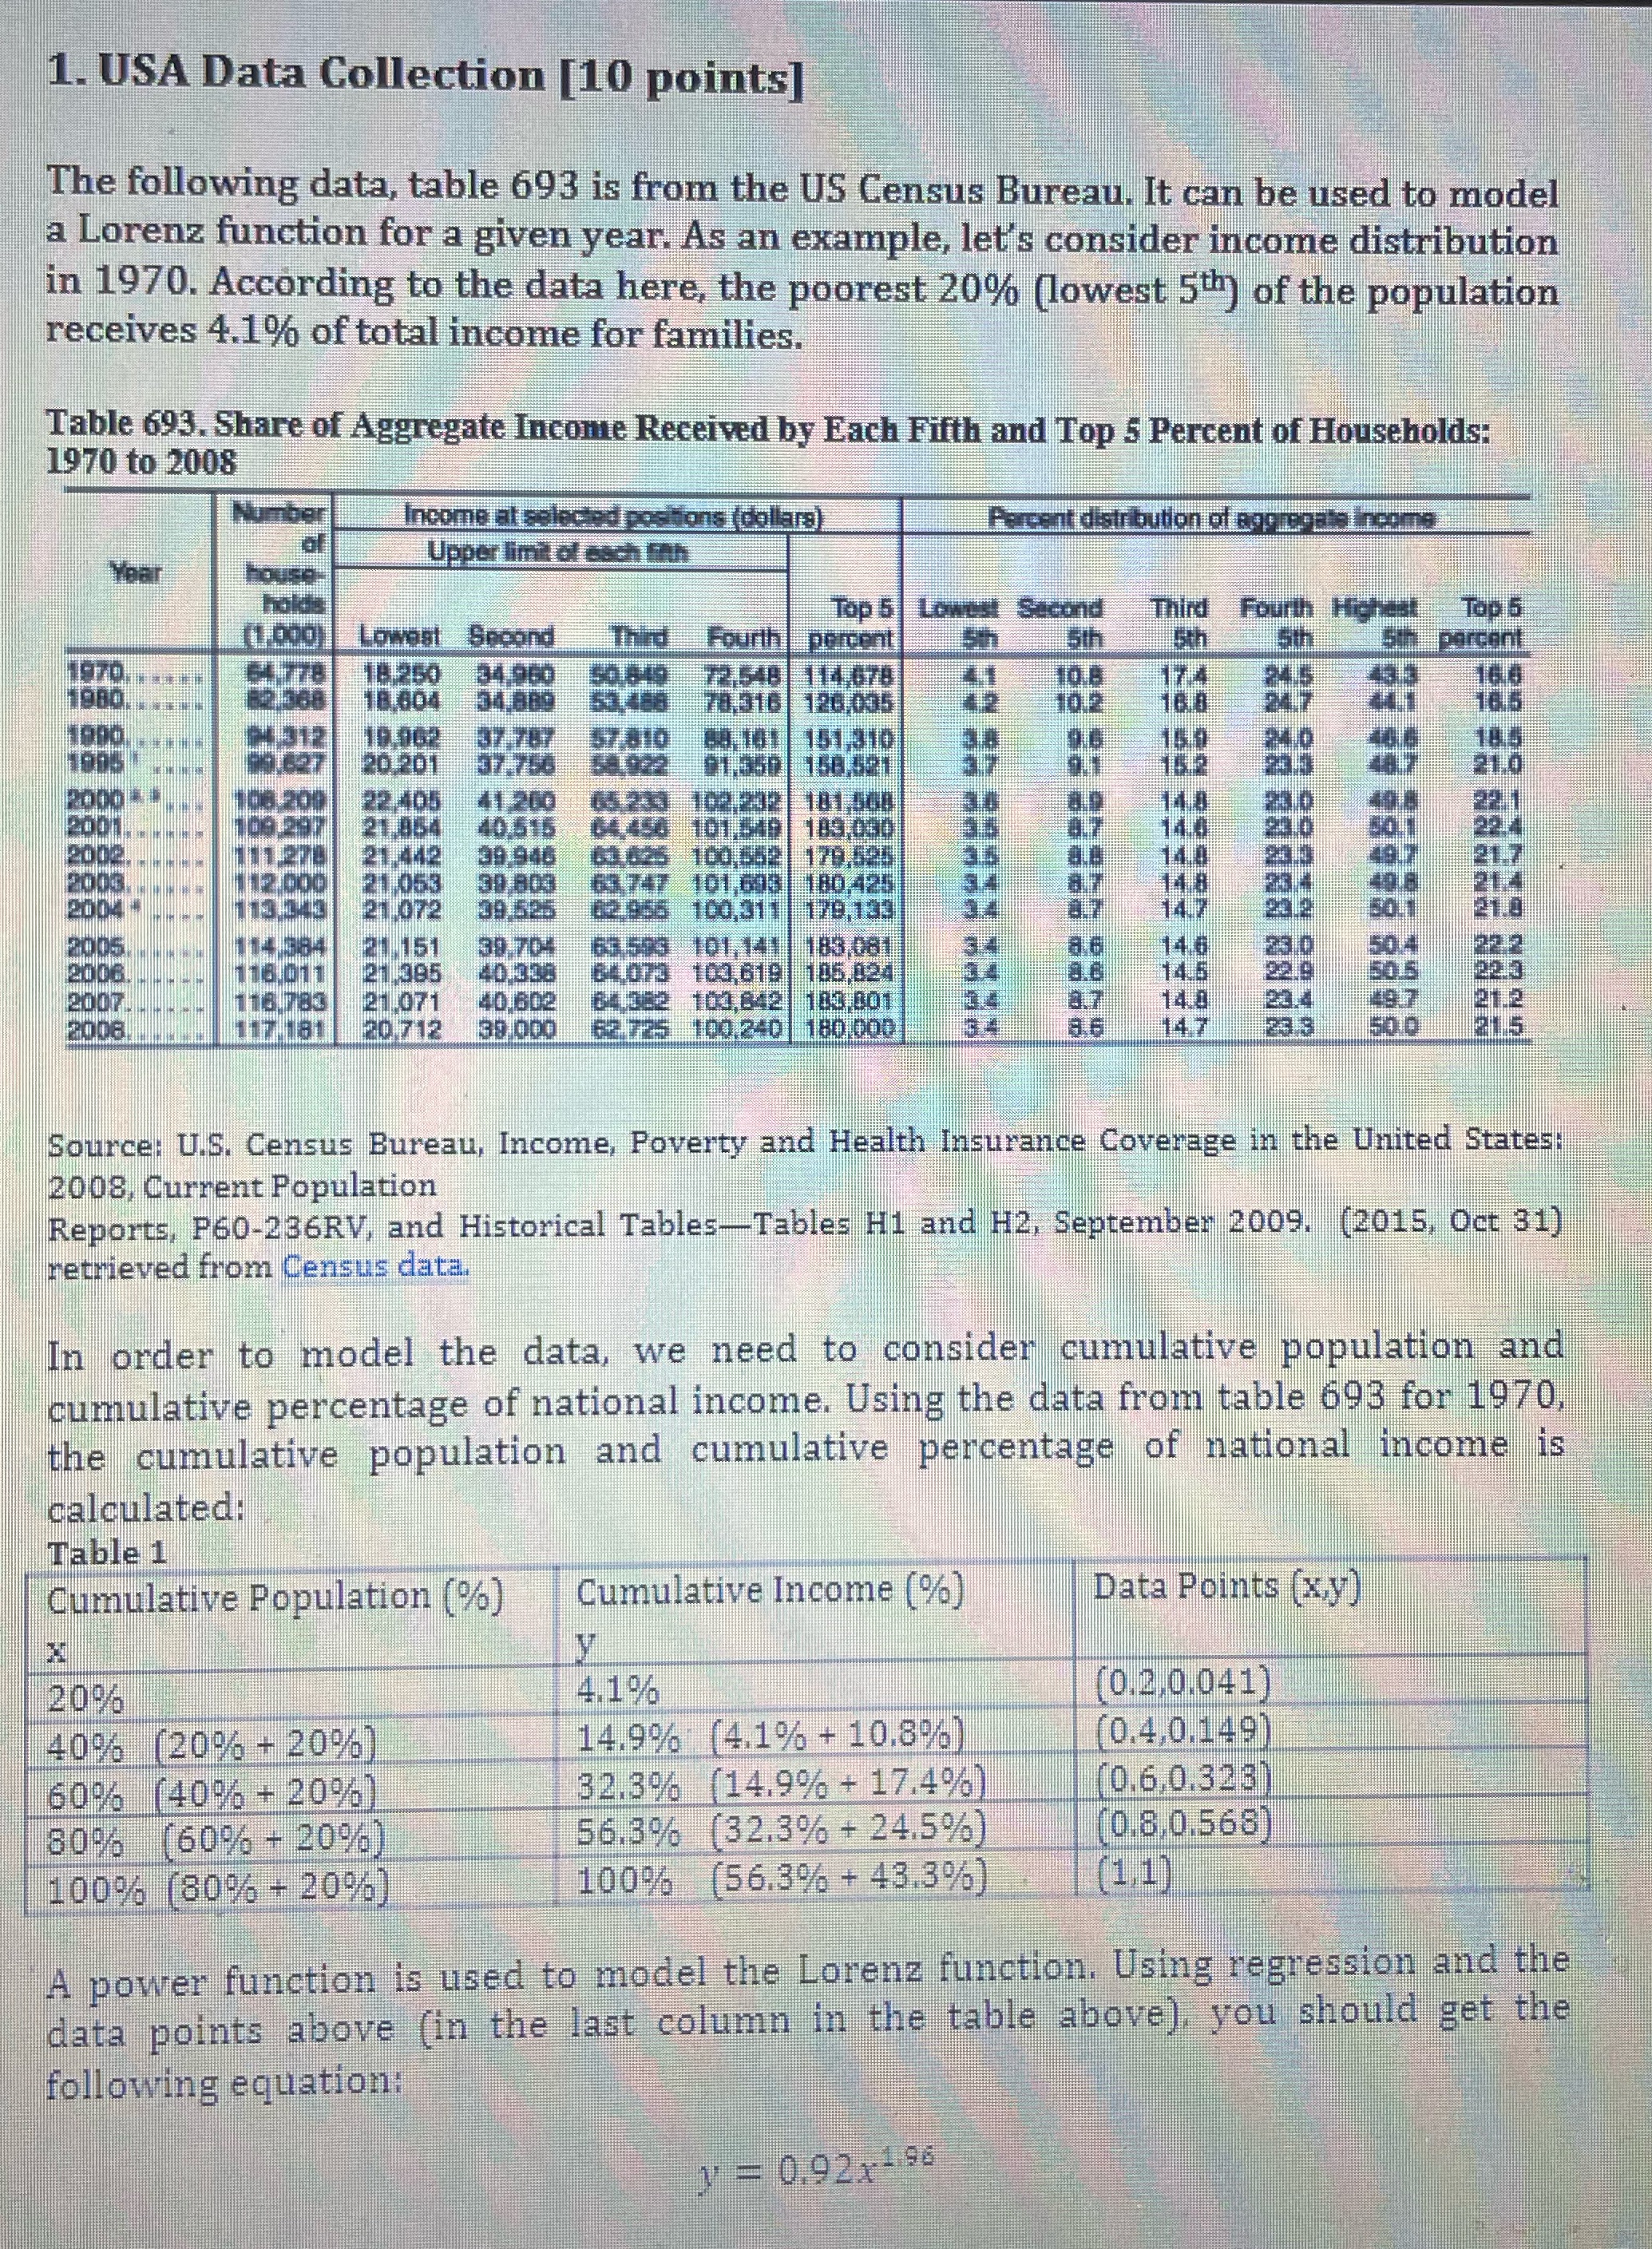
1. USA Data Collection [10 points] The following data, table 693 is from the US Census Bureau. It can be used to model a Lorenz

Step by Step Solution
There are 3 Steps involved in it
Step: 1

Get Instant Access to Expert-Tailored Solutions
See step-by-step solutions with expert insights and AI powered tools for academic success
Step: 2

Step: 3
Ace Your Homework with AI
Get the answers you need in no time with our AI-driven, step-by-step assistance
Get Started
Graph Theory And Its Applications
Authors: Jonathan L Gross, Jay Yellen
2nd Edition
1420057146, 9781420057140