Answered step by step
Verified Expert Solution
Link Copied!

Question

1 Approved Answer

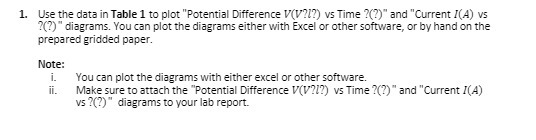
1. Use the data in Table 1 to plot Potential Difference V(V?/?) vs Time ?(?) and Current /(A) vs ?(?) diagrams. You can plot the

image text in transcribed
1. Use the data in Table 1 to plot "Potential Difference V(V?/?) vs Time ?(?)" and "Current /(A) vs ?(?)" diagrams. You can plot the diagrams either with Excel or other software, or by hand on the prepared gridded paper. Note: You can plot the diagrams with either excel or other software. ii. Make sure to attach the "Potential Difference V(V?/?) vs Time ?(?)" and "Current I(A) vs ?(?)" diagrams to your lab report

Step by Step Solution

There are 3 Steps involved in it

Step: 1

blur-text-image

Get Instant Access to Expert-Tailored Solutions

See step-by-step solutions with expert insights and AI powered tools for academic success

Step: 2

blur-text-image

Step: 3

blur-text-image

Ace Your Homework with AI

Get the answers you need in no time with our AI-driven, step-by-step assistance

Get Started

Recommended Textbook for

Astronomy A Physical Perspective A Physical Perspective

Authors: Marc L Kutner

2nd Edition

0511075464, 9780511075469

More Books

Students also viewed these Physics questions

Question

Discuss the various types of policies ?

Answered: 1 week ago

Question

Briefly explain the various types of leadership ?

Answered: 1 week ago

Question

Explain the need for and importance of co-ordination?

Answered: 1 week ago

Question

Explain the contribution of Peter F. Drucker to Management .

Answered: 1 week ago