Question
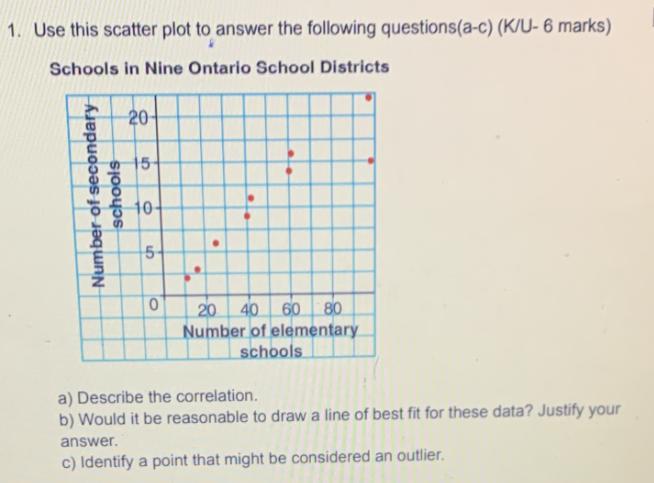
1. Use this scatter plot to answer the following questions(a-c) (K/U-6 marks) Schools in Nine Ontario School Districts Number of secondary schools 20 15

1. Use this scatter plot to answer the following questions(a-c) (K/U-6 marks) Schools in Nine Ontario School Districts Number of secondary schools 20 15 10- 5 0 20 40 60 80 Number of elementary schools a) Describe the correlation. b) Would it be reasonable to draw a line of best fit for these data? Justify your answer. c) Identify a point that might be considered an outlier.
Step by Step Solution
There are 3 Steps involved in it
Step: 1

Get Instant Access to Expert-Tailored Solutions
See step-by-step solutions with expert insights and AI powered tools for academic success
Step: 2

Step: 3

Ace Your Homework with AI
Get the answers you need in no time with our AI-driven, step-by-step assistance
Get StartedRecommended Textbook for
Statistical Reasoning For Everyday Life
Authors: Jeff Bennett, William Briggs, Mario Triola
5th Edition
9780134494043
Students also viewed these Mathematics questions
Question
Answered: 1 week ago
Question
Answered: 1 week ago
Question
Answered: 1 week ago
Question
Answered: 1 week ago
Question
Answered: 1 week ago
Question
Answered: 1 week ago
Question
Answered: 1 week ago
Question
Answered: 1 week ago
Question
Answered: 1 week ago
Question
Answered: 1 week ago
Question
Answered: 1 week ago
Question
Answered: 1 week ago
Question
Answered: 1 week ago
Question
Answered: 1 week ago
Question
Answered: 1 week ago
Question
Answered: 1 week ago
Question
Answered: 1 week ago
Question
Answered: 1 week ago
Question
Answered: 1 week ago
View Answer in SolutionInn App


