1. Using information given in the case, allocate the company's shared costs to each service line four different ways: Based on FTEs, direct-labor costs, direct labor plus direct materials, and the specific usage information given to Finnegan by Bennett (second image below)
2. Calculate the profit percentage for each service line under each overhead-allocation method
3. Which service line is the most financially attractive?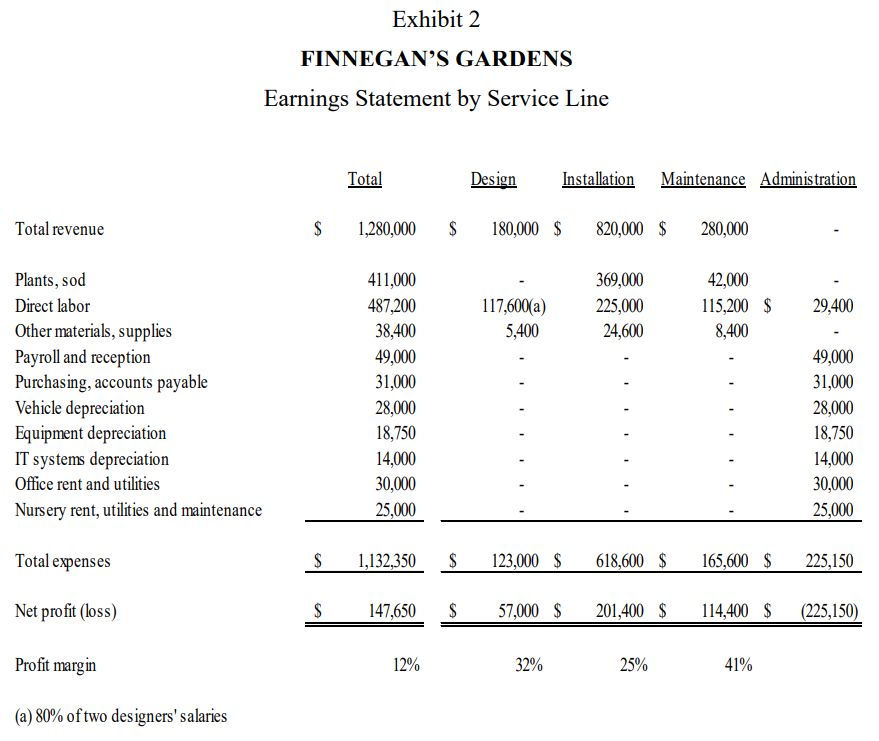
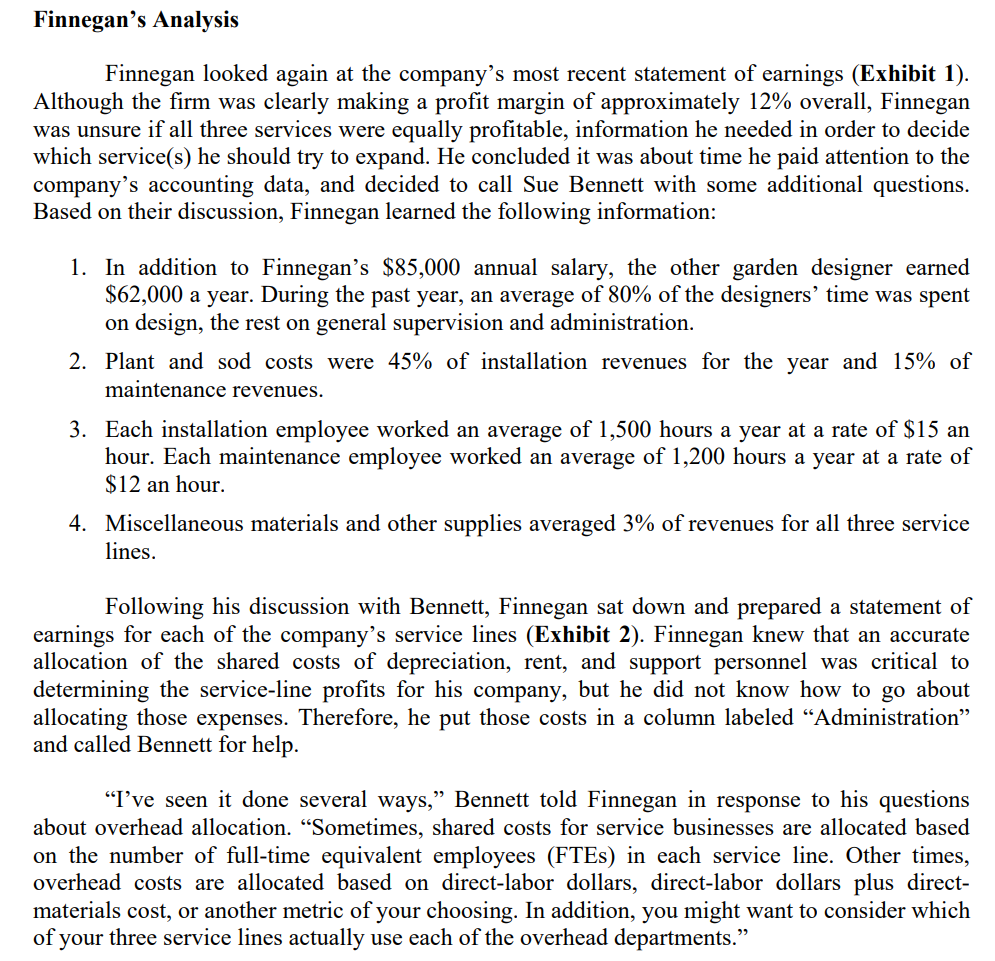
Exhibit 2 FINNEGAN'S GARDENS Earnings Statement by Service Line Total Design Installation Maintenance Administration Total revenue $ 1,280,000 $ 180,000 $ 820,000 $ 280,000 369,000 225,000 24,600 117,600(a) 5,400 42,000 115,200 $ 8,400 29,400 Plants, sod Direct labor Other materials, supplies Payroll and reception Purchasing, accounts payable Vehicle depreciation Equipment depreciation IT systems depreciation Office rent and utilities Nursery rent, utilities and maintenance 411,000 487,200 38,400 49,000 31,000 28,000 18,750 14,000 30,000 25,000 49,000 31,000 28,000 18,750 14,000 30,000 25,000 Total expenses $ 1,132,350 $ 123,000 $ 618,600 $ 165,600 $ 225,150 Net profit (loss) $ 147,650 $ 57,000 $ 201,400 $ 114,400 $ (225,150) Profit margin 12% 32% 25% 41% (a) 80% of two designers' salaries Finnegan's Analysis Finnegan looked again at the company's most recent statement of earnings (Exhibit 1). Although the firm was clearly making a profit margin of approximately 12% overall, Finnegan was unsure if all three services were equally profitable, information he needed in order to decide which service(s) he should try to expand. He concluded it was about time he paid attention to the company's accounting data, and decided to call Sue Bennett with some additional questions. Based on their discussion, Finnegan learned the following information: 1. In addition to Finnegan's $85,000 annual salary, the other garden designer earned $62,000 a year. During the past year, an average of 80% of the designers' time was spent on design, the rest on general supervision and administration. 2. Plant and sod costs were 45% of installation revenues for the year and 15% of maintenance revenues. 3. Each installation employee worked an average of 1,500 hours a year at a rate of $15 an hour. Each maintenance employee worked an average of 1,200 hours a year at a rate of $12 an hour. 4. Miscellaneous materials and other supplies averaged 3% of revenues for all three service lines. Following his discussion with Bennett, Finnegan sat down and prepared a statement of earnings for each of the company's service lines (Exhibit 2). Finnegan knew that an accurate allocation of the shared costs of depreciation, rent, and support personnel was critical to determining the service-line profits for his company, but he did not know how to go about allocating those expenses. Therefore, he put those costs in a column labeled Administration and called Bennett for help. "I've seen it done several ways, Bennett told Finnegan in response to his questions about overhead allocation. Sometimes, shared costs for service businesses are allocated based on the number of full-time equivalent employees (FTEs) in each service line. Other times, overhead costs are allocated based on direct-labor dollars, direct-labor dollars plus direct- materials cost, or another metric of your choosing. In addition, you might want to consider which of your three service lines actually use each of the overhead departments. Exhibit 2 FINNEGAN'S GARDENS Earnings Statement by Service Line Total Design Installation Maintenance Administration Total revenue $ 1,280,000 $ 180,000 $ 820,000 $ 280,000 369,000 225,000 24,600 117,600(a) 5,400 42,000 115,200 $ 8,400 29,400 Plants, sod Direct labor Other materials, supplies Payroll and reception Purchasing, accounts payable Vehicle depreciation Equipment depreciation IT systems depreciation Office rent and utilities Nursery rent, utilities and maintenance 411,000 487,200 38,400 49,000 31,000 28,000 18,750 14,000 30,000 25,000 49,000 31,000 28,000 18,750 14,000 30,000 25,000 Total expenses $ 1,132,350 $ 123,000 $ 618,600 $ 165,600 $ 225,150 Net profit (loss) $ 147,650 $ 57,000 $ 201,400 $ 114,400 $ (225,150) Profit margin 12% 32% 25% 41% (a) 80% of two designers' salaries Finnegan's Analysis Finnegan looked again at the company's most recent statement of earnings (Exhibit 1). Although the firm was clearly making a profit margin of approximately 12% overall, Finnegan was unsure if all three services were equally profitable, information he needed in order to decide which service(s) he should try to expand. He concluded it was about time he paid attention to the company's accounting data, and decided to call Sue Bennett with some additional questions. Based on their discussion, Finnegan learned the following information: 1. In addition to Finnegan's $85,000 annual salary, the other garden designer earned $62,000 a year. During the past year, an average of 80% of the designers' time was spent on design, the rest on general supervision and administration. 2. Plant and sod costs were 45% of installation revenues for the year and 15% of maintenance revenues. 3. Each installation employee worked an average of 1,500 hours a year at a rate of $15 an hour. Each maintenance employee worked an average of 1,200 hours a year at a rate of $12 an hour. 4. Miscellaneous materials and other supplies averaged 3% of revenues for all three service lines. Following his discussion with Bennett, Finnegan sat down and prepared a statement of earnings for each of the company's service lines (Exhibit 2). Finnegan knew that an accurate allocation of the shared costs of depreciation, rent, and support personnel was critical to determining the service-line profits for his company, but he did not know how to go about allocating those expenses. Therefore, he put those costs in a column labeled Administration and called Bennett for help. "I've seen it done several ways, Bennett told Finnegan in response to his questions about overhead allocation. Sometimes, shared costs for service businesses are allocated based on the number of full-time equivalent employees (FTEs) in each service line. Other times, overhead costs are allocated based on direct-labor dollars, direct-labor dollars plus direct- materials cost, or another metric of your choosing. In addition, you might want to consider which of your three service lines actually use each of the overhead departments.