

Question
1. Using the data for TXN compute the average growth rate of FCF (whole firm) using Excel's LOGEST or LINEST function. Express your answer in
1. Using the data for TXN compute the average growth rate of FCF (whole firm) using Excel's LOGEST or LINEST function. Express your answer in decimal notation (i.e., use 0.0123 for 1.23%). You will use this growth rate as the super-normal growth rate (gs) in the following problem.
Important notes:
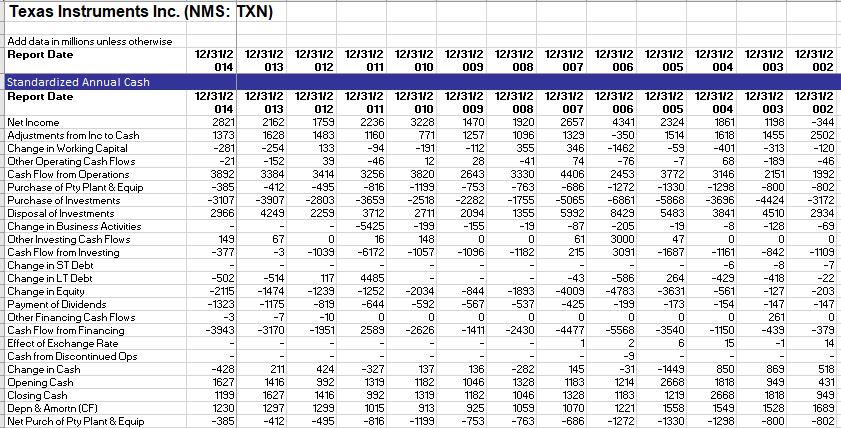
1) FCF = Cash flow from operations less capital expenditures
E.g., for example, for the 12/31/2014 period
FCF_2014 = 3892 - 385 = 3507
2) You must sort FCFs vertically from oldest to newest prior to using the LOGEST or LINEST function.
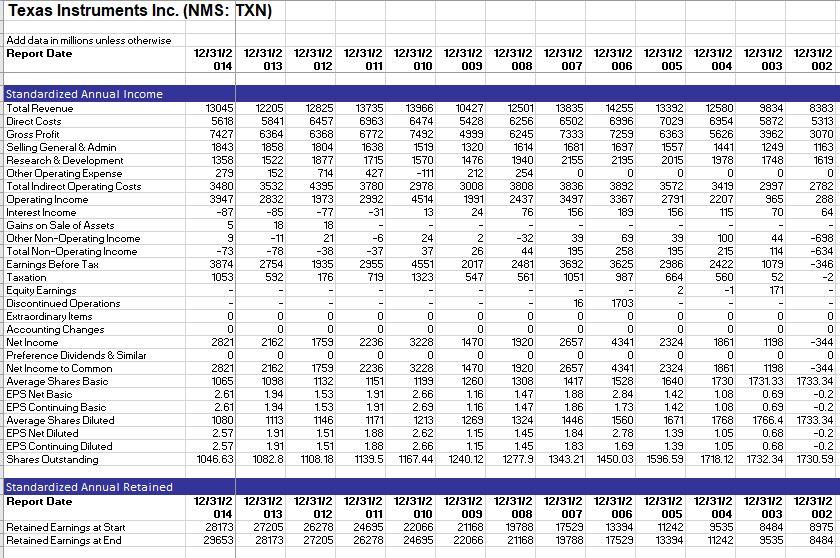
2. Apply the MGF (Multi-Growth Free Cash Flow) model to TXN, using the super-normal growth rate (gs) from the previous problem, long-term growth rate g=4.44%, and WACC=10% to find the Value of operations (Vop). Express your answer in millions (i.e., use 12,300.00 to represent 12.3 billion).
3. Using the data for TXN on Dropbox, and the answers to the previous two problems, compute the intrinsic value per share (based on Average shares diluted) for TXN stock using the MGF (multi-growth FCF) model.
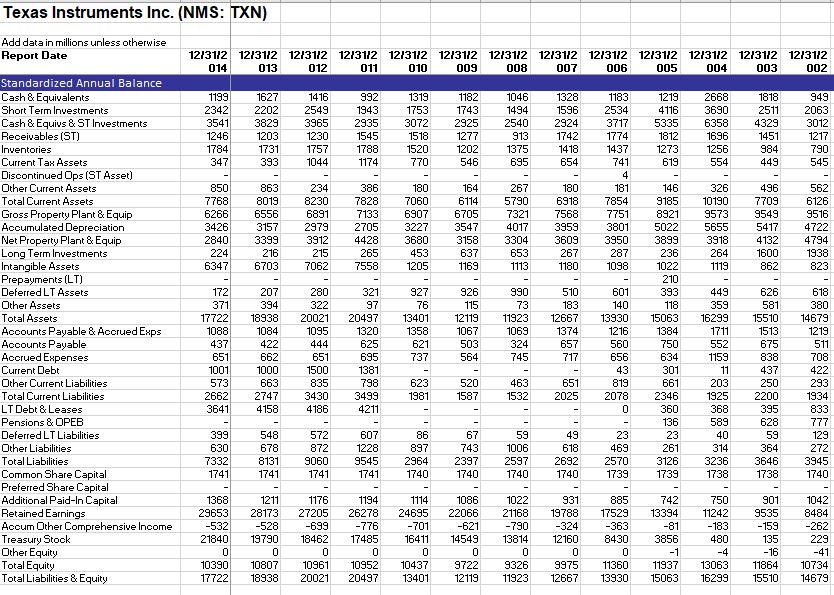
Texas Instruments Inc. (NMS: TXN) Add data in millions unless otherwise Report Date 12/31/2 12/31/2 12/31/2 12/31/2 12/31/2 12/31/2 014 013 012 011 010 009 12/31/2 12/31/2 12/31/2 12/31/2 12/31/2 12/31/2 12/31/2 008 007 006 005 004 003 002 1199 2342 3541 1246 1784 347 1627 2202 3829 1203 1731 393 1416 2549 3965 1230 1757 1044 992 1943 2935 1545 1788 1174 1319 1753 3072 1518 1520 770 1182 1743 2925 1277 1202 546 1046 1494 2540 913 1375 695 1328 1596 2924 1742 1418 654 1219 4116 5335 1812 1273 619 2668 3690 6358 1696 1256 554 1818 2511 4329 1451 984 449 949 2063 3012 1217 790 545 1183 2534 3717 1774 1437 741 4 181 7854 7751 3801 3950 287 1098 267 146 496 850 7768 6266 3426 2840 224 6347 863 8019 6556 3157 3399 216 6703 234 8230 6891 2979 3912 215 7062 386 7828 7133 2705 4428 265 7558 180 7060 6907 3227 3680 453 1205 164 6114 6705 3547 3158 637 1169 5790 7321 4017 3304 653 1113 180 6918 7568 3959 3609 267 1180 326 10190 9573 5655 3918 264 1119 7709 9549 5417 4132 1600 862 562 6126 9516 4722 4794 1938 823 Standardized Annual Balance Cash & Equivalents Short Term Investments Cash & Equivs & ST Investments Receivables (ST) Inventories Current Tax Assets Discontinued Ops (ST Asset) Other Current Assets Total Current Assets Gross Property Plant & Equip Accumulated Depreciation Net Property Plant & Equip Long Term Investments Intangible Assets Prepayments (LT) Deferred LT Assets Other Assets Total Assets Accounts Payable & Accrued Exps Accounts Payable Accrued Expenses Current Debt Other Current Liabilities Total Current Liabilities LT Debt & Leases Pensions & OPEB Deferred LT Liabilities Other Liabilities Total Liabilities Common Share Capital Preferred Share Capital Additional Paid-In Capital Retained Earnings Accum Other Comprehensive Income Treasury Stock Other Equity Total Equity Total Liabilities & Equity 172 371 17722 1088 437 651 1001 573 2662 3641 207 394 18938 1084 422 662 1000 663 2747 4158 280 322 20021 1095 444 651 1500 835 3430 4186 321 97 20497 1320 625 695 1381 798 3499 4211 927 76 13401 1358 621 737 926 115 12119 1067 503 564 990 73 11923 1069 324 745 510 183 12667 1374 657 717 601 140 13930 1216 560 656 43 819 2078 0 9185 8921 5022 3899 236 1022 210 393 118 15063 1384 750 634 301 661 2346 360 136 23 261 3126 1739 626 581 15510 1513 675 838 437 623 1981 520 1587 463 1532 651 2025 449 359 16299 1711 552 1159 11 203 1925 368 589 40 314 3236 1738 618 380 14679 1219 511 708 422 293 1934 833 777 129 272 3945 1740 250 2200 395 628 59 364 3646 1738 399 630 7332 1741 548 678 8131 1741 572 872 9060 1741 607 1228 9545 1741 86 897 2964 1740 67 743 2397 1740 59 1006 2597 1740 49 618 2692 1740 23 469 2570 1739 1368 29653 -532 21840 0 10390 17722 1211 28173 -528 19790 0 10807 18938 1176 27205 -699 18462 0 10961 20021 1194 26278 -776 17485 0 10952 20497 10000 1114 24695 -701 16411 0 10437 13401 1086 22066 -621 14549 0 9722 12119 1022 21168 -790 13814 0 9326 11923 931 19788 -324 12160 0 9975 12667 885 17529 -363 8430 0 11360 13930 742 13394 -81 3856 -1 11937 15063 750 11242 -183 480 -4 13063 16299 901 9535 - 159 135 -16 11864 15510 1042 8484 -262 229 -41 10734 14679 Texas Instruments Inc. (NMS: TXN) Add data in millions unless otherwise Report Date 12/31/2 12/31/2 12/31/2 12/31/2 12/3112 12/31/2 12/3112 12/31/2 12/31/2 12/31/2 12/31/2 12/31/2 12/31/2 014 013 012 011 010 009 008 007 006 005 004 003 002 13045 5618 7427 1843 1358 279 3480 3947 -87 5 9 -73 3874 1053 12205 5841 6364 1858 1522 152 3532 2832 -85 18 - 11 -78 2754 592 12825 6457 6368 1804 1877 714 4395 1973 -77 18 21 -38 1935 176 13735 6963 6772 1638 1715 427 3780 2992 -31 13966 6474 7492 1519 1570 -111 2978 4514 13 10427 5428 4999 1320 1476 212 3008 1991 24 12501 6256 6245 1614 1940 254 3808 2437 76 13835 6502 7333 1681 2155 0 3836 3497 156 14255 6996 7259 1697 2195 0 3892 3367 189 13392 7029 6363 1557 2015 0 3572 2791 156 12580 6954 5626 1441 1978 0 3419 2207 115 9834 5872 3962 1249 1748 0 2997 965 70 Standardized Annual Income Total Revenue Direct Costs Gross Profit Selling General & Admin Research & Development Other Operating Expense Total Indirect Operating Costs Operating Income Interest Income Gains on Sale of Assets Other Non-Operating Income Total Non-Operating Income Earnings Before Tax Taxation Equity Earnings Discontinued Operations Extraordinary Items Accounting Changes Net Income Preference Dividends & Similar Net Income to Common Average Shares Basic EPS Net Basic EPS Continuing Basic Average Shares Diluted EPS Net Diluted EPS Continuing Diluted Shares Outstanding 8383 5313 3070 1163 1619 0 2782 288 64 -32 -698 -6 -37 2955 719 24 37 4551 1323 2 26 2017 547 44 2481 561 39 195 3692 1051 69 258 3625 987 39 195 2986 664 2 100 215 2422 560 -1 44 114 1079 52 171 -634 -346 -2 I! TIO O 0 0 2821 0 2821 1065 2.61 2.61 1080 2.57 2.57 1046.63 0 2162 0 2162 1098 1.94 1.94 1113 1.91 1.91 1082.8 0 0 1759 0 1759 1132 1.53 1.53 1146 1.51 1.51 1108.18 0 0 2236 0 2236 1151 1.91 1.91 1171 1.88 1.88 1139.5 0 3228 0 3228 1199 2.66 2.69 1213 2.62 2.66 1167.44 0 0 1470 0 1470 1260 1.16 1.16 1269 1.15 1.15 1240.12 0 0 1920 0 1920 1308 1.47 1.47 1324 1.45 1.45 1277.9 16 0 0 2657 0 2657 1417 1.88 1.86 1446 1.84 1.83 1343.21 1703 0 0 4341 0 4341 1528 2.84 1.73 1560 2.78 1.69 1450.03 0 0 2324 0 2324 1640 1.42 1.42 1671 1.39 1.39 1596.59 O 0 0 0 1861 1198 0 0 1861 1198 1730 1731.33 1.08 0.69 1.08 0.69 1768 1766.4 1.05 0.68 1.05 0.68 1718.12 1732.34 0 0 -344 0 -344 1733.34 -0.2 -0.2 1733.34 -0.2 -0.2 1730.59 Standardized Annual Retained Report Date Retained Earnings at Start Retained Earnings at End 12/31/2 12/31/2 12/31/2 12/31/2 12/31/2 12/31/2 12/31/2 12/31/2 014 013 012 011 010 009 008 007 28173 27205 26278 24695 22066 21168 19788 17529 29653 28173 27205 26278 24695 22066 21168 19788 12/31/2 12/31/2 12/31/2 006 005 004 13394 11242 9535 17529 13394 11242 12/31/2 12/31/2 003 002 8484 8975 9535 8484 011 Texas Instruments Inc. (NMS: TXN) Add data in millions unless otherwise Report Date 12/31/2 12/31/2 12/31/2 12/31/2 12/31/2 12/31/2 12/31/2 12/31/2 12/31/2 12/31/2 12/31/2 12/31/2 12/31/2 014 013 012 011 010 009 008 007 006 005 004 003 002 Standardized Annual Cash Report Date 12/31/2 12/31/2 12/31/2 12/31/2 12/31/2 12/31/2 12/31/2 12/31/2 12/31/2 12/31/2 12/31/2 12/31/2 12/31/2 014 013 012 010 009 008 007 006 005 004 003 002 Net Income 2821 2162 1759 2236 3228 1470 1920 2657 4341 2324 1861 1198 -344 Adjustments from Ino to Cash 1373 1628 1483 1160 771 1257 1096 1329 -350 1514 1618 1455 2502 Change in Working Capital -281 -254 133 -94 -191 - 112 355 346 -1462 -59 -401 -313 -120 Other Operating Cash Flows -21 -152 39 -46 12 28 -41 74 -76 -7 68 -189 -46 Cash Flow from Operations 3892 3384 3414 3256 3820 2643 3330 4406 2453 3772 3146 2151 1992 Purchase of Pty Plant & Equip -385 -412 -495 -816 - 1199 -753 -763 -686 -1272 -1330 -1298 -800 -802 Purchase of Investments -3107 -3907 -2803 -3659 -2518 -2282 -1755 -5065 -6861 -5868 -3696 -4424 -3172 Disposal of Investments 2966 4249 2259 3712 2711 2094 1355 5992 8429 5483 3841 4510 2934 Change in Business Activities -5425 - 199 -155 -19 -87 -205 -19 -8 -128 -69 Other Investing Cash Flows 149 67 0 16 148 0 0 61 3000 47 0 0 0 Cash Flow from Investing -377 -3 -1039 -6172 -1057 -1096 - 1182 215 3091 -1687 - 1161 -842 -1109 Change in ST Debt -6 -8 -7 Change in LT Debt -502 -514 117 4485 -43 -586 264 -429 -418 -22 Change in Equity -2115 -1474 -1239 -1252 -2034 -844 -1893 -4009 -4783 -3631 -561 -127 -203 Payment of Dividends -1323 -1175 -819 -644 -592 -567 -537 -425 -199 -173 -154 -147 -147 Other Financing Cash Flows -3 -7 -10 0 0 0 0 0 0 0 0 261 0 Cash Flow from Financing -3943 -3170 -1951 2589 -2626 -1411 -2430 -4477 -5568 -3540 - 1150 -439 -379 Effect of Exchange Rate 1 2 6 15 -1 14 Cash from Discontinued Ops -9 Change in Cash -428 211 424 -327 137 136 -282 145 -31 -1449 850 869 518 Opening Cash 1627 1416 992 1319 1182 1046 1328 1183 1214 2668 1818 949 431 Closing Cash 1199 1627 1416 992 1319 1182 1046 1328 1183 1219 2668 1818 949 Depn & Amortn (CF) 1230 1297 1299 1015 913 925 1059 1070 1221 1558 1549 1528 1689 Net Purch of Pty Plant & Equip -385 -412 -495 -816 - 1199 -753 -763 -686 -1272 - 1330 - 1298 -800 -802 Texas Instruments Inc. (NMS: TXN) Add data in millions unless otherwise Report Date 12/31/2 12/31/2 12/31/2 12/31/2 12/31/2 12/31/2 014 013 012 011 010 009 12/31/2 12/31/2 12/31/2 12/31/2 12/31/2 12/31/2 12/31/2 008 007 006 005 004 003 002 1199 2342 3541 1246 1784 347 1627 2202 3829 1203 1731 393 1416 2549 3965 1230 1757 1044 992 1943 2935 1545 1788 1174 1319 1753 3072 1518 1520 770 1182 1743 2925 1277 1202 546 1046 1494 2540 913 1375 695 1328 1596 2924 1742 1418 654 1219 4116 5335 1812 1273 619 2668 3690 6358 1696 1256 554 1818 2511 4329 1451 984 449 949 2063 3012 1217 790 545 1183 2534 3717 1774 1437 741 4 181 7854 7751 3801 3950 287 1098 267 146 496 850 7768 6266 3426 2840 224 6347 863 8019 6556 3157 3399 216 6703 234 8230 6891 2979 3912 215 7062 386 7828 7133 2705 4428 265 7558 180 7060 6907 3227 3680 453 1205 164 6114 6705 3547 3158 637 1169 5790 7321 4017 3304 653 1113 180 6918 7568 3959 3609 267 1180 326 10190 9573 5655 3918 264 1119 7709 9549 5417 4132 1600 862 562 6126 9516 4722 4794 1938 823 Standardized Annual Balance Cash & Equivalents Short Term Investments Cash & Equivs & ST Investments Receivables (ST) Inventories Current Tax Assets Discontinued Ops (ST Asset) Other Current Assets Total Current Assets Gross Property Plant & Equip Accumulated Depreciation Net Property Plant & Equip Long Term Investments Intangible Assets Prepayments (LT) Deferred LT Assets Other Assets Total Assets Accounts Payable & Accrued Exps Accounts Payable Accrued Expenses Current Debt Other Current Liabilities Total Current Liabilities LT Debt & Leases Pensions & OPEB Deferred LT Liabilities Other Liabilities Total Liabilities Common Share Capital Preferred Share Capital Additional Paid-In Capital Retained Earnings Accum Other Comprehensive Income Treasury Stock Other Equity Total Equity Total Liabilities & Equity 172 371 17722 1088 437 651 1001 573 2662 3641 207 394 18938 1084 422 662 1000 663 2747 4158 280 322 20021 1095 444 651 1500 835 3430 4186 321 97 20497 1320 625 695 1381 798 3499 4211 927 76 13401 1358 621 737 926 115 12119 1067 503 564 990 73 11923 1069 324 745 510 183 12667 1374 657 717 601 140 13930 1216 560 656 43 819 2078 0 9185 8921 5022 3899 236 1022 210 393 118 15063 1384 750 634 301 661 2346 360 136 23 261 3126 1739 626 581 15510 1513 675 838 437 623 1981 520 1587 463 1532 651 2025 449 359 16299 1711 552 1159 11 203 1925 368 589 40 314 3236 1738 618 380 14679 1219 511 708 422 293 1934 833 777 129 272 3945 1740 250 2200 395 628 59 364 3646 1738 399 630 7332 1741 548 678 8131 1741 572 872 9060 1741 607 1228 9545 1741 86 897 2964 1740 67 743 2397 1740 59 1006 2597 1740 49 618 2692 1740 23 469 2570 1739 1368 29653 -532 21840 0 10390 17722 1211 28173 -528 19790 0 10807 18938 1176 27205 -699 18462 0 10961 20021 1194 26278 -776 17485 0 10952 20497 10000 1114 24695 -701 16411 0 10437 13401 1086 22066 -621 14549 0 9722 12119 1022 21168 -790 13814 0 9326 11923 931 19788 -324 12160 0 9975 12667 885 17529 -363 8430 0 11360 13930 742 13394 -81 3856 -1 11937 15063 750 11242 -183 480 -4 13063 16299 901 9535 - 159 135 -16 11864 15510 1042 8484 -262 229 -41 10734 14679 Texas Instruments Inc. (NMS: TXN) Add data in millions unless otherwise Report Date 12/31/2 12/31/2 12/31/2 12/31/2 12/3112 12/31/2 12/3112 12/31/2 12/31/2 12/31/2 12/31/2 12/31/2 12/31/2 014 013 012 011 010 009 008 007 006 005 004 003 002 13045 5618 7427 1843 1358 279 3480 3947 -87 5 9 -73 3874 1053 12205 5841 6364 1858 1522 152 3532 2832 -85 18 - 11 -78 2754 592 12825 6457 6368 1804 1877 714 4395 1973 -77 18 21 -38 1935 176 13735 6963 6772 1638 1715 427 3780 2992 -31 13966 6474 7492 1519 1570 -111 2978 4514 13 10427 5428 4999 1320 1476 212 3008 1991 24 12501 6256 6245 1614 1940 254 3808 2437 76 13835 6502 7333 1681 2155 0 3836 3497 156 14255 6996 7259 1697 2195 0 3892 3367 189 13392 7029 6363 1557 2015 0 3572 2791 156 12580 6954 5626 1441 1978 0 3419 2207 115 9834 5872 3962 1249 1748 0 2997 965 70 Standardized Annual Income Total Revenue Direct Costs Gross Profit Selling General & Admin Research & Development Other Operating Expense Total Indirect Operating Costs Operating Income Interest Income Gains on Sale of Assets Other Non-Operating Income Total Non-Operating Income Earnings Before Tax Taxation Equity Earnings Discontinued Operations Extraordinary Items Accounting Changes Net Income Preference Dividends & Similar Net Income to Common Average Shares Basic EPS Net Basic EPS Continuing Basic Average Shares Diluted EPS Net Diluted EPS Continuing Diluted Shares Outstanding 8383 5313 3070 1163 1619 0 2782 288 64 -32 -698 -6 -37 2955 719 24 37 4551 1323 2 26 2017 547 44 2481 561 39 195 3692 1051 69 258 3625 987 39 195 2986 664 2 100 215 2422 560 -1 44 114 1079 52 171 -634 -346 -2 I! TIO O 0 0 2821 0 2821 1065 2.61 2.61 1080 2.57 2.57 1046.63 0 2162 0 2162 1098 1.94 1.94 1113 1.91 1.91 1082.8 0 0 1759 0 1759 1132 1.53 1.53 1146 1.51 1.51 1108.18 0 0 2236 0 2236 1151 1.91 1.91 1171 1.88 1.88 1139.5 0 3228 0 3228 1199 2.66 2.69 1213 2.62 2.66 1167.44 0 0 1470 0 1470 1260 1.16 1.16 1269 1.15 1.15 1240.12 0 0 1920 0 1920 1308 1.47 1.47 1324 1.45 1.45 1277.9 16 0 0 2657 0 2657 1417 1.88 1.86 1446 1.84 1.83 1343.21 1703 0 0 4341 0 4341 1528 2.84 1.73 1560 2.78 1.69 1450.03 0 0 2324 0 2324 1640 1.42 1.42 1671 1.39 1.39 1596.59 O 0 0 0 1861 1198 0 0 1861 1198 1730 1731.33 1.08 0.69 1.08 0.69 1768 1766.4 1.05 0.68 1.05 0.68 1718.12 1732.34 0 0 -344 0 -344 1733.34 -0.2 -0.2 1733.34 -0.2 -0.2 1730.59 Standardized Annual Retained Report Date Retained Earnings at Start Retained Earnings at End 12/31/2 12/31/2 12/31/2 12/31/2 12/31/2 12/31/2 12/31/2 12/31/2 014 013 012 011 010 009 008 007 28173 27205 26278 24695 22066 21168 19788 17529 29653 28173 27205 26278 24695 22066 21168 19788 12/31/2 12/31/2 12/31/2 006 005 004 13394 11242 9535 17529 13394 11242 12/31/2 12/31/2 003 002 8484 8975 9535 8484 011 Texas Instruments Inc. (NMS: TXN) Add data in millions unless otherwise Report Date 12/31/2 12/31/2 12/31/2 12/31/2 12/31/2 12/31/2 12/31/2 12/31/2 12/31/2 12/31/2 12/31/2 12/31/2 12/31/2 014 013 012 011 010 009 008 007 006 005 004 003 002 Standardized Annual Cash Report Date 12/31/2 12/31/2 12/31/2 12/31/2 12/31/2 12/31/2 12/31/2 12/31/2 12/31/2 12/31/2 12/31/2 12/31/2 12/31/2 014 013 012 010 009 008 007 006 005 004 003 002 Net Income 2821 2162 1759 2236 3228 1470 1920 2657 4341 2324 1861 1198 -344 Adjustments from Ino to Cash 1373 1628 1483 1160 771 1257 1096 1329 -350 1514 1618 1455 2502 Change in Working Capital -281 -254 133 -94 -191 - 112 355 346 -1462 -59 -401 -313 -120 Other Operating Cash Flows -21 -152 39 -46 12 28 -41 74 -76 -7 68 -189 -46 Cash Flow from Operations 3892 3384 3414 3256 3820 2643 3330 4406 2453 3772 3146 2151 1992 Purchase of Pty Plant & Equip -385 -412 -495 -816 - 1199 -753 -763 -686 -1272 -1330 -1298 -800 -802 Purchase of Investments -3107 -3907 -2803 -3659 -2518 -2282 -1755 -5065 -6861 -5868 -3696 -4424 -3172 Disposal of Investments 2966 4249 2259 3712 2711 2094 1355 5992 8429 5483 3841 4510 2934 Change in Business Activities -5425 - 199 -155 -19 -87 -205 -19 -8 -128 -69 Other Investing Cash Flows 149 67 0 16 148 0 0 61 3000 47 0 0 0 Cash Flow from Investing -377 -3 -1039 -6172 -1057 -1096 - 1182 215 3091 -1687 - 1161 -842 -1109 Change in ST Debt -6 -8 -7 Change in LT Debt -502 -514 117 4485 -43 -586 264 -429 -418 -22 Change in Equity -2115 -1474 -1239 -1252 -2034 -844 -1893 -4009 -4783 -3631 -561 -127 -203 Payment of Dividends -1323 -1175 -819 -644 -592 -567 -537 -425 -199 -173 -154 -147 -147 Other Financing Cash Flows -3 -7 -10 0 0 0 0 0 0 0 0 261 0 Cash Flow from Financing -3943 -3170 -1951 2589 -2626 -1411 -2430 -4477 -5568 -3540 - 1150 -439 -379 Effect of Exchange Rate 1 2 6 15 -1 14 Cash from Discontinued Ops -9 Change in Cash -428 211 424 -327 137 136 -282 145 -31 -1449 850 869 518 Opening Cash 1627 1416 992 1319 1182 1046 1328 1183 1214 2668 1818 949 431 Closing Cash 1199 1627 1416 992 1319 1182 1046 1328 1183 1219 2668 1818 949 Depn & Amortn (CF) 1230 1297 1299 1015 913 925 1059 1070 1221 1558 1549 1528 1689 Net Purch of Pty Plant & Equip -385 -412 -495 -816 - 1199 -753 -763 -686 -1272 - 1330 - 1298 -800 -802
Step by Step Solution
There are 3 Steps involved in it
Step: 1

Get Instant Access to Expert-Tailored Solutions
See step-by-step solutions with expert insights and AI powered tools for academic success
Step: 2

Step: 3
Ace Your Homework with AI
Get the answers you need in no time with our AI-driven, step-by-step assistance
Get Started
Investments An Introduction
Authors: Herbert B. Mayo
13th Edition
0357127951, 978-0357127957