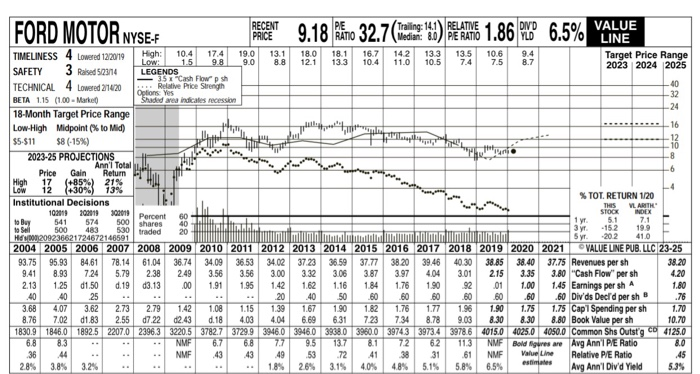
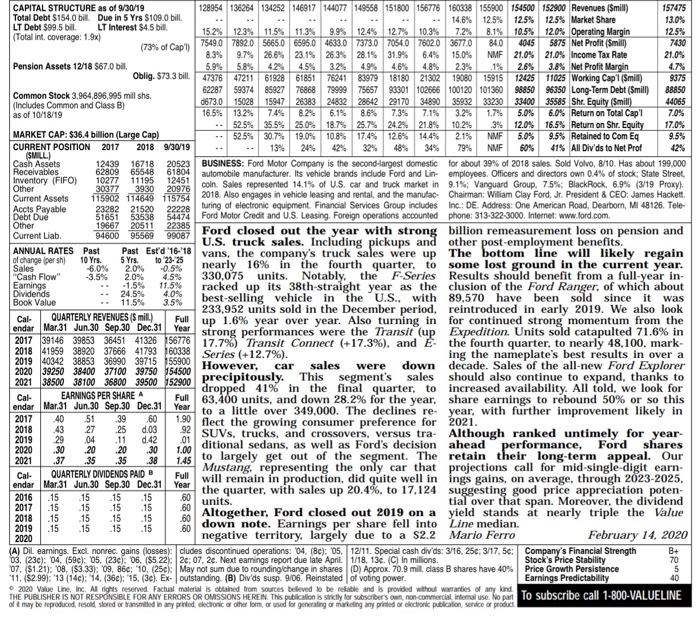
1. Using the financial statement information for Ford (F) evaluate the company using Warren Buffet's 15 percent rule. 2. Is Ford an attractive investment? Why or why not? FORD MOTOR NY -F 9.18 RTO 32.70 1.86 6.5% VALUE LINE TI, The no 12 2 21% RECENT PE Trailing: 14.1 RELATIVE DIVD PRICE Median: 80) PE RATIO YLD TIMELINESS 4 Lowered 12/20/19 High: 10.4 17.4 19.0 13.1 18.0 18.1 16.7 142 13.3 13.5 10.6 9.4 Low: 1.5 9.8 9.0 Target Price Range 8.8 12.1 13.3 10.4 11.0 10.5 7.4 7.5 8.7 SAFETY 3 Raised 52304 LEGENDS 2023 2024 2025 35 x Cash Flow"psh TECHNICAL 4 Lowered 214/20 Relative Price Strength 40 Options Yes BETA 115 (1.00 - Marke Shaded area indicates recession -32 18-Month Target Price Range .24 Low-High Midpoint (% to Mid) 16 $5-$11 $8 (-15%) -12 10 2023-25 PROJECTIONS -8 Ann'l Total Price Gain Return -6 High Low 13% .4 Institutional Decisions % TOT RETURN 1/20 THIS 102019 202010 VL ARTH 60 STOCK to Buy 541 574 40 1 yr 5.1 7.1 to Sell 500 483 20 -152 19.9 Hd 1000209236621724672146591 nummi Syr 202 41.0 2004 2005 2006 2007 2008 2009 2010 2011 2012 2013 2014 2015 2016 2017 2018 2019 2020 2021 VALUE LINE PUB, LLC 23-25 93.75 95.93 84.61 78.14 61.04 36.74 34.09 36.53 34.02 37.23 36.59 37.77 38.20 39.46 40.30 38.85 38.40 37.75 Revenues per sh 38.20 9.41 8.93 7.24 5.79 2.38 2.49 3.56 3.56 3.00 3.32 3.06 3.87 3.97 4.04 3.01 2.15 3.35 3.80 "Cash Flow" per sh 4.20 2.13 1.25 d1.50 d. 19 d3.13 .00 1.91 1.95 1.42 1.62 1.16 1.84 1.76 1.90 92 .01 1.00 1.45 Earnings per sh A 1.80 .40 40 25 20 .40 50 .60 60 60 .60 60 .60 .60 Divds Decld per sh .76 3.68 4.07 3.62 2.73 2.79 1.42 1.08 1.15 1.39 1.67 1.90 1.82 1.76 1.77 1.96 1.90 1.75 1.75 Cap 1 Spending per sh 1.70 8.76 7.02 d1.83 2.55 d7.22 d2.43 d. 18 4.03 4.04 6.69 6.31 723 7.34 8.78 9.03 8.30 8.30 8.80 Book Value per sh 10.70 1830.9 1846.0 1892.5 2207.0 23963 3220.5 3782.7 3729.9 3946.0 3946.0 3938.0 3960.0 39743 3973.4 3978.6 4015.0 4025.0 4050.0 Common Shs Outstg CD 4125.0 6.8 8.3 NMF 6.7 6.8 77 9.5 13.7 8.1 7.2 6.2 11.3 NMF Bold figures are Avg Anni PE Ratio 36 .44 NMF .43 43 49 53 .72 41 38 31 61 NMF Value Line Relative P/E Ratio .45 28% 3.8% 3.2% 1.8% 2.6% 3.15 40% 4.8% 5.1% 5.8% 6.5% esti Avg Ann'l Divd Yield 5.3% 2011 Percent 500 shares 530 traded 3y -1.5% CAPITAL STRUCTURE as of 9/30/19 128954 136264 134252 146917 144077 149558 151800 156776 160338 155900 154500 152900 Revenues (Smil) 157475 Total Debt $154.0 bill. Due in 5 Yrs $109.0 bill. 14.6% 12.5% 12.5% 12.5% Market Share 13.0% LT Debt $99.5 bil LT Interest $4.5 bil (Total int coverage: 1.9x) 15.2% 123% 11.5% 11.3% 9.9% 12.4% 12.7% 10.3% 7.2% 8.1% 10.5% 12.0% Operating Margin 12.5% (73% of Capi) 7549.0 7892.0 5665.0 6595.0 4633.0 7373.0 7054.0 76020 3677.0 84.0 4045 5875 Net Profit (Smill 7430 8.3% 9.7% 26.6% 23.1% 26.3% 28.1% 31.9% 6.4% 15.0% NMF 21.0% 21.0% Income Tax Rate 21.0% Pension Assets 12/18 $67.0 bill. 5.9% 5.8% 42% 4.5% 3.2% 4.9% 4.6% 4.8% 2.3% 2.6% 3.8% Net Profit Margin 4.7% Oblig. $73.3 bill 47376 47211 61928 61851 76241 83979 18180 21302 19080 15915 12425 11025 Working Cap'l (Smill) 9375 62287 59374 85927 76868 79999 75657 88301 102666 100120 101360 Common Stock 3,964,896,995 mil shs. 98850 96350 Long-Term Debt (Smill) 88850 (Includes Common and Class B) d673.0 15028 15947 26383 24832 28642 29170 34890 35932 33230 33400 35585 Shr. Equity (Smill) 44065 as of 10/18/19 16.5% 13.2% 7.4% 8.2% 6.1% 7.3% 7.1% 3.2% 1.7% 5.0% 6.0% Return on Total Cap' 7.0% 52.5% 35.5% 25.0% 18.7% 25.7% 24.2% 21.8% 10.2% MARKET CAP: $36.4 billion (Large Cap) 3% 12.0% 16.5% Return on Shr. Equity 17.0% 52.5% 30.7% 19.0% 10.8% 17.4% 12.6% 14.4% 2.1% NMF 5.0% 9.5% Retained to Com Eq 9.5% CURRENT POSITION 2017 2018 9/30/19 13% 429 48% 34% 79% NMF 60% (SMILL) 41% All Div'ds to Net Prof Cash Assets 12439 16718 20523 BUSINESS: Ford Motor Company is the second-largest domestic for about 39% of 2018 sales. Sold Volvo, 8/10. Has about 199,000 Receivables 62809 65548 61804 Inventory (FIFO) 10277 automobile manufacturer. Its vehicle brands include Ford and Lin employees. Officers and directors own 0.4% of stock, State Street, 11195 12451 Other 30377 3930 20976 coln. Sales represented 14.1% of U.S. car and truck market in 9.1%: Vanguard Group. 7.5%: Black Rock. 6.9% (3/19 Proxy). Current Assets 115902 114649 115754 2018. Also engages in vehicle leasing and rental, and the manufac- Chairman: William Clay Ford, Jr. President & CEO: James Hackett Acets Payable 23282 21520 22228 turing of electronic equipment. Financial Services Group includes Inc.: DE. Address: One American Road, Dearborn, MI 48126. Tele- Debt Due 51651 53538 54474 Ford Motor Credit and U.S. Leasing. Foreign operations accounted phone: 313-322-3000. Internet: www.ford.com Other 19667 20511 22385 Current Liab 94600 95569 99087 Ford closed out the year with strong billion remeasurement loss on pension and U.S. truck sales. Including pickups and other post-employment benefits. ANNUAL RATES Past of change per shi 10 Yrs. Past Estd 16-18 vans, the company's truck sales were up The bottom line will likely regain Sales -6.0% 2.0% -0.5% nearly 16% in the fourth quarter to some lost ground in the current year. "Cash Flow" -3.5% 2.0% 4.5% 330,075 units. Notably, the F-Series Results should benefit from a full-year in- Earnings 11.5% racked up its 38th-straight year as the clusion of the Ford Ranger, of which about Dividends 24.5% 4.0% Book Value 11.5% 3.5% best-selling vehicle in the U.S., with 89,570 have been sold since it was 233,952 units sold in the December period, reintroduced in early 2019. We also look Cal QUARTERLY REVENUES($ mill) Full endar Mar 31 Jun 30 Sep.30 Dec.31 up 1.6% year over year. Also turning in for continued strong momentum from the Year strong performances were the Transit (up Expedition. Units sold catapulted 71.6% in 2017 39146 39853 36451 41326 56776 17.7%) Transit Connect (+17.3%), and the fourth quarter, to nearly 48,100, mark- 2018 41959 38920 37666 41793 60338 2019 40342 38853 36990 39715 55900 Series (+12.7%). ing the nameplate's best results in over a 2020 39250 38400 3100 39760 154500 precipitously. This segment's sales should also continue to expand, thanks to However, car sales were down decade. Sales of the all-new Ford Explorer 2021 38500 38100 36800 39500152900 dropped 41% in the final quarter to increased availability. All fold, we look for Cal EARNINGS PER SHARE A Full endar Mar 31 Jun 30 Sep.30 Dec.31 63,400 units, and down 28.2% for the year, share earnings to rebound 50% or so this Year to a little over 349,000. The declines re year, with further improvement likely in 2017 40 -51 39 .60 1,90 flect the growing consumer preference for 2021. 2018 .43 27 25 d.03 92 2019 29 .04 .11 d.42 .01 SUVs, trucks, and crossovers, versus tra- Although ranked untimely for year- 2020 30 20 20 .30 1.00 ditional sedans, as well as Ford's decision ahead performance, Ford shares 2021 37 .35 .35 .38 1.45 to largely get out of the segment. The retain their long-term appeal. Our Cal QUARTERLY DIVIDENDS PAID B Mustang representing the only car that projections call for mid-single-digit earn- Full endar Mar.31 Jun 30 Sep.30 Dec.31 Year will remain in production, did quite well in ings gains, on average, through 2023-2025, 2016 .15 .15 .15 the quarter, with sales up 20.4%, to 17,124 suggesting good price appreciation poten .15 2017 .15 units. .15 .15 tial over that span. Moreover, the dividend 2018 .15 .15 .15 15 Altogether, Ford closed out 2019 on a yield stands at nearly triple the Value .15 .15 .15 .15 down note. Earnings per share fell into Line median. 2020 negative territory, largely due to a $2.2 Mario Ferro February 14, 2020 (A) DiL earnings. Excl nonrec. gains (losses: cludes discontinued operations: 04 (8C): 05, 12/11. Special cash div'ds: 3/16, 25c: 3/17, 56: Company's Financial Strength B+ 03. 23c): 04 (59c): 05, (2301. 06. ($5.22: 20:07, 2c. Next eamings report due late April 1/18. 136. (C) In millions Stock's Price Stability 70 07. $1.21): 08. ($3.33): 09.86c: '10.25 May not sum due to rounding change in shares (D) Approx. 70.9 mil. class B shares have 40% Price Growth Persistence 5 "11. ($2.99): "13 (14c): 114, (360): "15. (3). Ex- outstanding. (B) Div'ds susp. 9/06. Reinstated of voting power. Earnings Predictability 2020 Value Line, Inc. All rights reserved. Factual material is obtained from sources believed to be reliable and is provided without warranties of any kind. THE PUBLISHER IS NOT RESPONSIBLE FOR ANY ERRORS OR OMISSIONS HEREIN. This publication is strictly for subscribersoun, non-commercial internal use. No part to subscribe call 1-800-VALUELINE oft may be reproduced, resold stored or transmitted in any printed clectronic or other form, or used for generating or marketing any printed or electronic publication service or product 8888 2019 40 1. Using the financial statement information for Ford (F) evaluate the company using Warren Buffet's 15 percent rule. 2. Is Ford an attractive investment? Why or why not? FORD MOTOR NY -F 9.18 RTO 32.70 1.86 6.5% VALUE LINE TI, The no 12 2 21% RECENT PE Trailing: 14.1 RELATIVE DIVD PRICE Median: 80) PE RATIO YLD TIMELINESS 4 Lowered 12/20/19 High: 10.4 17.4 19.0 13.1 18.0 18.1 16.7 142 13.3 13.5 10.6 9.4 Low: 1.5 9.8 9.0 Target Price Range 8.8 12.1 13.3 10.4 11.0 10.5 7.4 7.5 8.7 SAFETY 3 Raised 52304 LEGENDS 2023 2024 2025 35 x Cash Flow"psh TECHNICAL 4 Lowered 214/20 Relative Price Strength 40 Options Yes BETA 115 (1.00 - Marke Shaded area indicates recession -32 18-Month Target Price Range .24 Low-High Midpoint (% to Mid) 16 $5-$11 $8 (-15%) -12 10 2023-25 PROJECTIONS -8 Ann'l Total Price Gain Return -6 High Low 13% .4 Institutional Decisions % TOT RETURN 1/20 THIS 102019 202010 VL ARTH 60 STOCK to Buy 541 574 40 1 yr 5.1 7.1 to Sell 500 483 20 -152 19.9 Hd 1000209236621724672146591 nummi Syr 202 41.0 2004 2005 2006 2007 2008 2009 2010 2011 2012 2013 2014 2015 2016 2017 2018 2019 2020 2021 VALUE LINE PUB, LLC 23-25 93.75 95.93 84.61 78.14 61.04 36.74 34.09 36.53 34.02 37.23 36.59 37.77 38.20 39.46 40.30 38.85 38.40 37.75 Revenues per sh 38.20 9.41 8.93 7.24 5.79 2.38 2.49 3.56 3.56 3.00 3.32 3.06 3.87 3.97 4.04 3.01 2.15 3.35 3.80 "Cash Flow" per sh 4.20 2.13 1.25 d1.50 d. 19 d3.13 .00 1.91 1.95 1.42 1.62 1.16 1.84 1.76 1.90 92 .01 1.00 1.45 Earnings per sh A 1.80 .40 40 25 20 .40 50 .60 60 60 .60 60 .60 .60 Divds Decld per sh .76 3.68 4.07 3.62 2.73 2.79 1.42 1.08 1.15 1.39 1.67 1.90 1.82 1.76 1.77 1.96 1.90 1.75 1.75 Cap 1 Spending per sh 1.70 8.76 7.02 d1.83 2.55 d7.22 d2.43 d. 18 4.03 4.04 6.69 6.31 723 7.34 8.78 9.03 8.30 8.30 8.80 Book Value per sh 10.70 1830.9 1846.0 1892.5 2207.0 23963 3220.5 3782.7 3729.9 3946.0 3946.0 3938.0 3960.0 39743 3973.4 3978.6 4015.0 4025.0 4050.0 Common Shs Outstg CD 4125.0 6.8 8.3 NMF 6.7 6.8 77 9.5 13.7 8.1 7.2 6.2 11.3 NMF Bold figures are Avg Anni PE Ratio 36 .44 NMF .43 43 49 53 .72 41 38 31 61 NMF Value Line Relative P/E Ratio .45 28% 3.8% 3.2% 1.8% 2.6% 3.15 40% 4.8% 5.1% 5.8% 6.5% esti Avg Ann'l Divd Yield 5.3% 2011 Percent 500 shares 530 traded 3y -1.5% CAPITAL STRUCTURE as of 9/30/19 128954 136264 134252 146917 144077 149558 151800 156776 160338 155900 154500 152900 Revenues (Smil) 157475 Total Debt $154.0 bill. Due in 5 Yrs $109.0 bill. 14.6% 12.5% 12.5% 12.5% Market Share 13.0% LT Debt $99.5 bil LT Interest $4.5 bil (Total int coverage: 1.9x) 15.2% 123% 11.5% 11.3% 9.9% 12.4% 12.7% 10.3% 7.2% 8.1% 10.5% 12.0% Operating Margin 12.5% (73% of Capi) 7549.0 7892.0 5665.0 6595.0 4633.0 7373.0 7054.0 76020 3677.0 84.0 4045 5875 Net Profit (Smill 7430 8.3% 9.7% 26.6% 23.1% 26.3% 28.1% 31.9% 6.4% 15.0% NMF 21.0% 21.0% Income Tax Rate 21.0% Pension Assets 12/18 $67.0 bill. 5.9% 5.8% 42% 4.5% 3.2% 4.9% 4.6% 4.8% 2.3% 2.6% 3.8% Net Profit Margin 4.7% Oblig. $73.3 bill 47376 47211 61928 61851 76241 83979 18180 21302 19080 15915 12425 11025 Working Cap'l (Smill) 9375 62287 59374 85927 76868 79999 75657 88301 102666 100120 101360 Common Stock 3,964,896,995 mil shs. 98850 96350 Long-Term Debt (Smill) 88850 (Includes Common and Class B) d673.0 15028 15947 26383 24832 28642 29170 34890 35932 33230 33400 35585 Shr. Equity (Smill) 44065 as of 10/18/19 16.5% 13.2% 7.4% 8.2% 6.1% 7.3% 7.1% 3.2% 1.7% 5.0% 6.0% Return on Total Cap' 7.0% 52.5% 35.5% 25.0% 18.7% 25.7% 24.2% 21.8% 10.2% MARKET CAP: $36.4 billion (Large Cap) 3% 12.0% 16.5% Return on Shr. Equity 17.0% 52.5% 30.7% 19.0% 10.8% 17.4% 12.6% 14.4% 2.1% NMF 5.0% 9.5% Retained to Com Eq 9.5% CURRENT POSITION 2017 2018 9/30/19 13% 429 48% 34% 79% NMF 60% (SMILL) 41% All Div'ds to Net Prof Cash Assets 12439 16718 20523 BUSINESS: Ford Motor Company is the second-largest domestic for about 39% of 2018 sales. Sold Volvo, 8/10. Has about 199,000 Receivables 62809 65548 61804 Inventory (FIFO) 10277 automobile manufacturer. Its vehicle brands include Ford and Lin employees. Officers and directors own 0.4% of stock, State Street, 11195 12451 Other 30377 3930 20976 coln. Sales represented 14.1% of U.S. car and truck market in 9.1%: Vanguard Group. 7.5%: Black Rock. 6.9% (3/19 Proxy). Current Assets 115902 114649 115754 2018. Also engages in vehicle leasing and rental, and the manufac- Chairman: William Clay Ford, Jr. President & CEO: James Hackett Acets Payable 23282 21520 22228 turing of electronic equipment. Financial Services Group includes Inc.: DE. Address: One American Road, Dearborn, MI 48126. Tele- Debt Due 51651 53538 54474 Ford Motor Credit and U.S. Leasing. Foreign operations accounted phone: 313-322-3000. Internet: www.ford.com Other 19667 20511 22385 Current Liab 94600 95569 99087 Ford closed out the year with strong billion remeasurement loss on pension and U.S. truck sales. Including pickups and other post-employment benefits. ANNUAL RATES Past of change per shi 10 Yrs. Past Estd 16-18 vans, the company's truck sales were up The bottom line will likely regain Sales -6.0% 2.0% -0.5% nearly 16% in the fourth quarter to some lost ground in the current year. "Cash Flow" -3.5% 2.0% 4.5% 330,075 units. Notably, the F-Series Results should benefit from a full-year in- Earnings 11.5% racked up its 38th-straight year as the clusion of the Ford Ranger, of which about Dividends 24.5% 4.0% Book Value 11.5% 3.5% best-selling vehicle in the U.S., with 89,570 have been sold since it was 233,952 units sold in the December period, reintroduced in early 2019. We also look Cal QUARTERLY REVENUES($ mill) Full endar Mar 31 Jun 30 Sep.30 Dec.31 up 1.6% year over year. Also turning in for continued strong momentum from the Year strong performances were the Transit (up Expedition. Units sold catapulted 71.6% in 2017 39146 39853 36451 41326 56776 17.7%) Transit Connect (+17.3%), and the fourth quarter, to nearly 48,100, mark- 2018 41959 38920 37666 41793 60338 2019 40342 38853 36990 39715 55900 Series (+12.7%). ing the nameplate's best results in over a 2020 39250 38400 3100 39760 154500 precipitously. This segment's sales should also continue to expand, thanks to However, car sales were down decade. Sales of the all-new Ford Explorer 2021 38500 38100 36800 39500152900 dropped 41% in the final quarter to increased availability. All fold, we look for Cal EARNINGS PER SHARE A Full endar Mar 31 Jun 30 Sep.30 Dec.31 63,400 units, and down 28.2% for the year, share earnings to rebound 50% or so this Year to a little over 349,000. The declines re year, with further improvement likely in 2017 40 -51 39 .60 1,90 flect the growing consumer preference for 2021. 2018 .43 27 25 d.03 92 2019 29 .04 .11 d.42 .01 SUVs, trucks, and crossovers, versus tra- Although ranked untimely for year- 2020 30 20 20 .30 1.00 ditional sedans, as well as Ford's decision ahead performance, Ford shares 2021 37 .35 .35 .38 1.45 to largely get out of the segment. The retain their long-term appeal. Our Cal QUARTERLY DIVIDENDS PAID B Mustang representing the only car that projections call for mid-single-digit earn- Full endar Mar.31 Jun 30 Sep.30 Dec.31 Year will remain in production, did quite well in ings gains, on average, through 2023-2025, 2016 .15 .15 .15 the quarter, with sales up 20.4%, to 17,124 suggesting good price appreciation poten .15 2017 .15 units. .15 .15 tial over that span. Moreover, the dividend 2018 .15 .15 .15 15 Altogether, Ford closed out 2019 on a yield stands at nearly triple the Value .15 .15 .15 .15 down note. Earnings per share fell into Line median. 2020 negative territory, largely due to a $2.2 Mario Ferro February 14, 2020 (A) DiL earnings. Excl nonrec. gains (losses: cludes discontinued operations: 04 (8C): 05, 12/11. Special cash div'ds: 3/16, 25c: 3/17, 56: Company's Financial Strength B+ 03. 23c): 04 (59c): 05, (2301. 06. ($5.22: 20:07, 2c. Next eamings report due late April 1/18. 136. (C) In millions Stock's Price Stability 70 07. $1.21): 08. ($3.33): 09.86c: '10.25 May not sum due to rounding change in shares (D) Approx. 70.9 mil. class B shares have 40% Price Growth Persistence 5 "11. ($2.99): "13 (14c): 114, (360): "15. (3). Ex- outstanding. (B) Div'ds susp. 9/06. Reinstated of voting power. Earnings Predictability 2020 Value Line, Inc. All rights reserved. Factual material is obtained from sources believed to be reliable and is provided without warranties of any kind. THE PUBLISHER IS NOT RESPONSIBLE FOR ANY ERRORS OR OMISSIONS HEREIN. This publication is strictly for subscribersoun, non-commercial internal use. No part to subscribe call 1-800-VALUELINE oft may be reproduced, resold stored or transmitted in any printed clectronic or other form, or used for generating or marketing any printed or electronic publication service or product 8888 2019 40