1. Using the information provided, what should SPs shares be trading at on the first day of its listing?
a. Conduct a DCF analysis.
b. Conduct a comparable companies analysis.
c. Would you recommend that Wang invest in SP? If so, at what price and investment horizon?
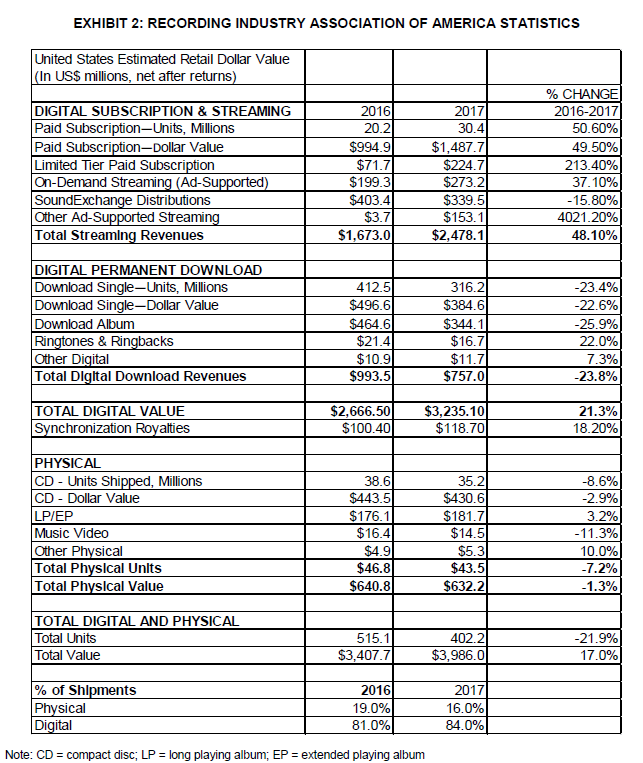
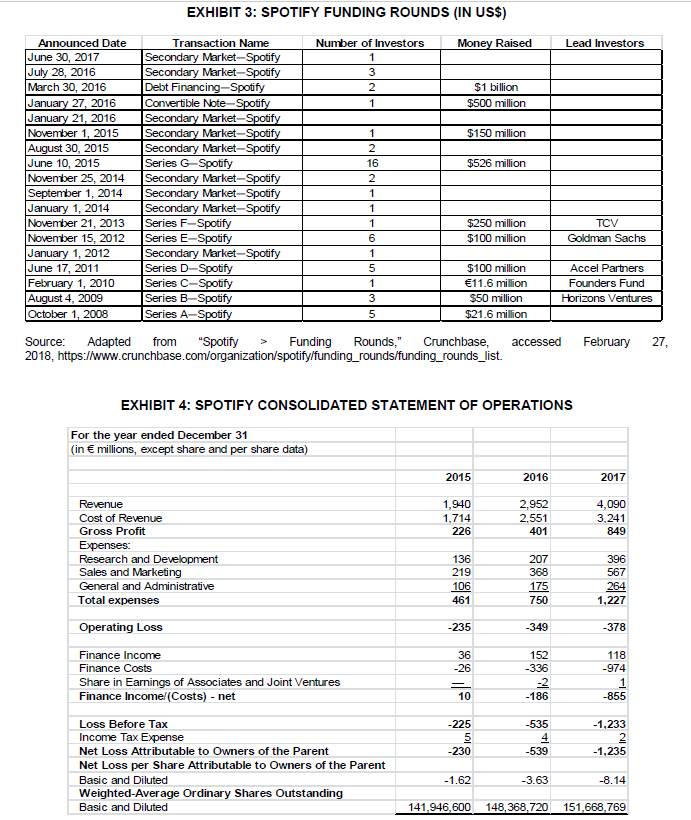
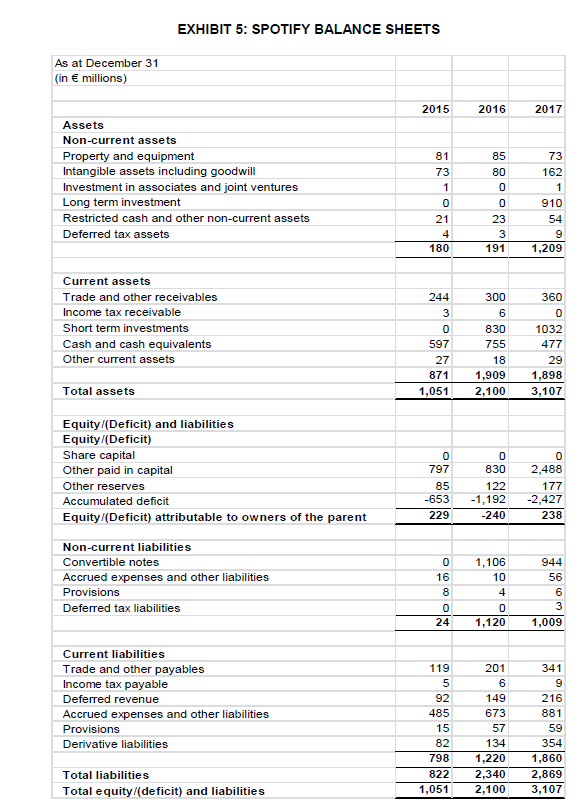
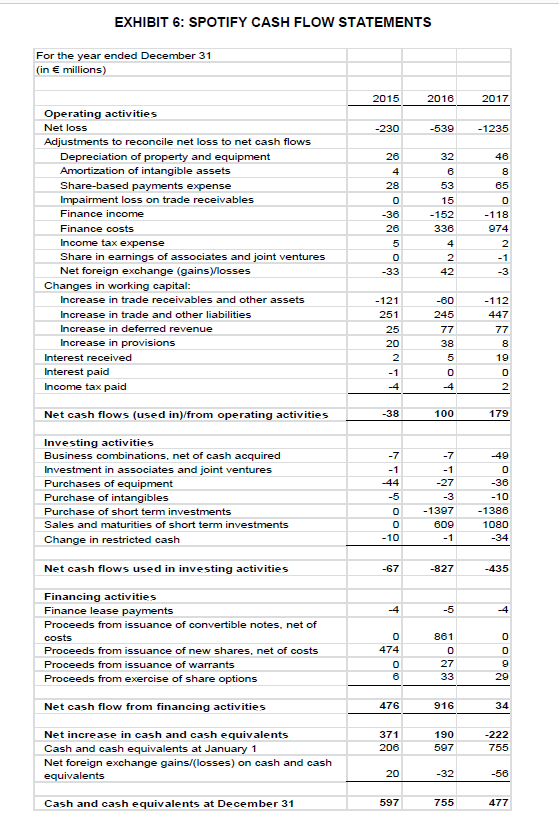
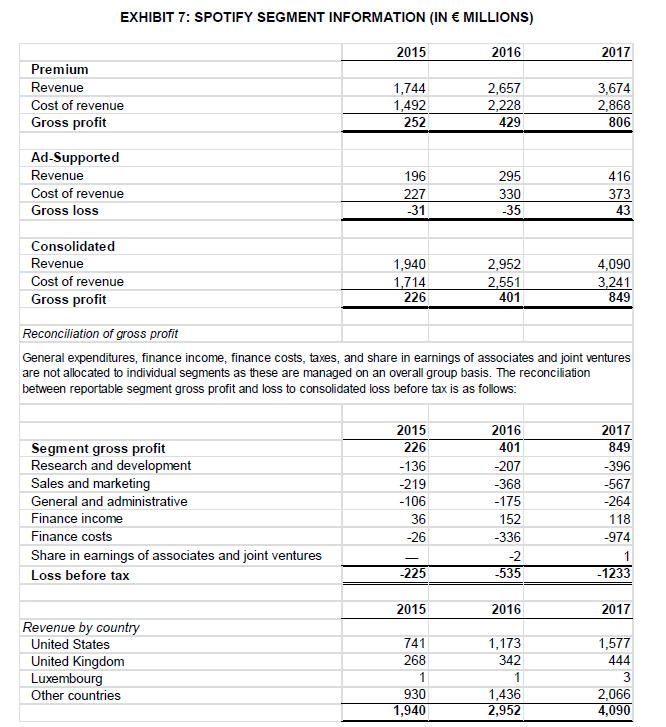
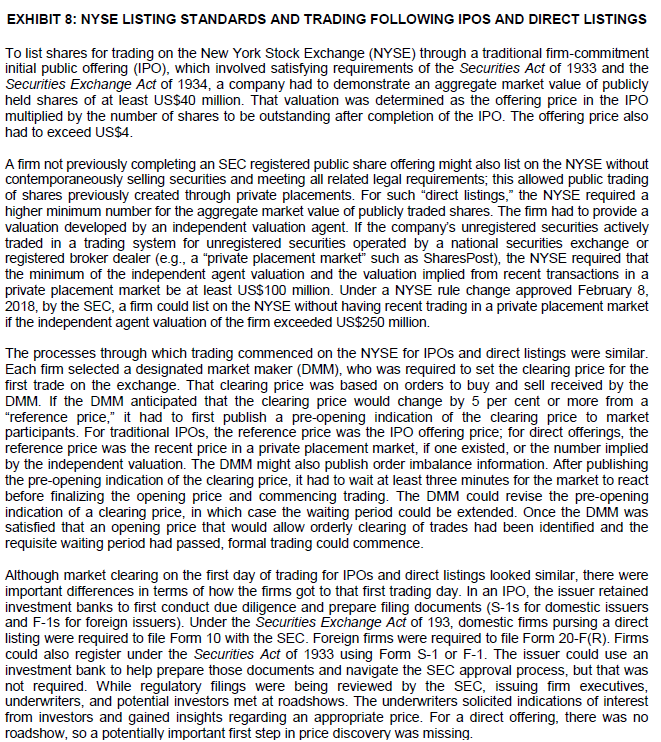
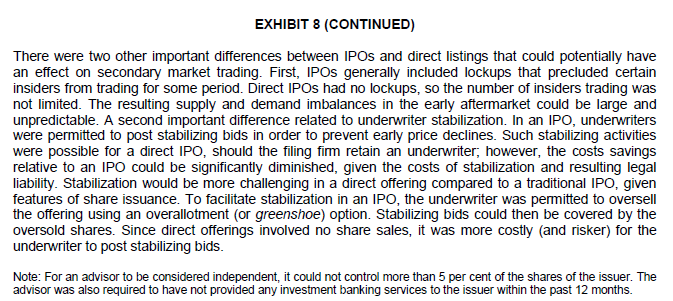
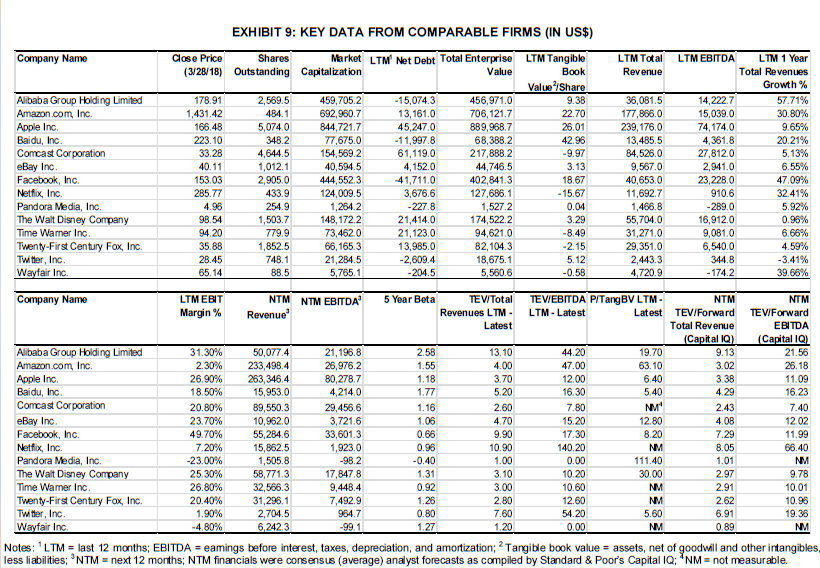
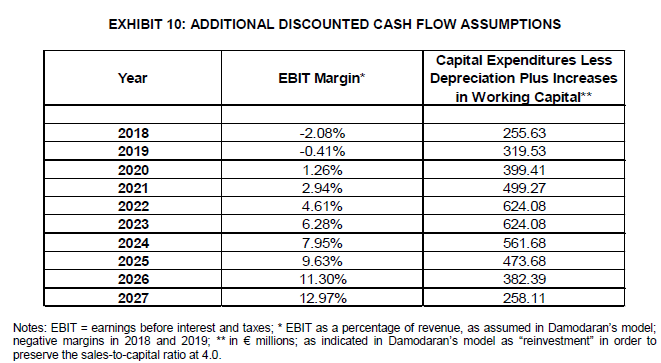
EXHIBIT 2: RECORDING INDUSTRY ASSOCIATION OF AMERICA STATISTICS United States Estimated Retail Dollar Value (In US$ millions, net after returns) DIGITAL SUBSCRIPTION & STREAMING Paid Subscription-Units, Millions Paid Subscription-Dollar Value Limited Tier Paid Subscription On-Demand Streaming (Ad-Supported) SoundExchange Distributions Other Ad-Supported Streaming Total Streaming Revenues 2016 20.2 $994.9 $71.7 $199.31 $403.4 $3.7 $1,673.0 2017 30.4 $1,487.7 $224.7 $273.21 $339.5 $153.1 $2,478.1 % CHANGE 2016-2017 50.60% 49.50% 213.40% 37.10% - 15.80% 4021.20% 48.10% DIGITAL PERMANENT DOWNLOAD Download Single-Units, Millions Download Single-Dollar Value Download Album Ringtones & Ringbacks Other Digital Total Digital Download Revenues 412.5 $496.6 $464.61 $21.4 $10.9 $993.5 316.21 $384.6 $344.1 $16.7 $11.71 $757.0 -23.4% -22.6% -25.9% 22.0% 7.3% -23.8% TOTAL DIGITAL VALUE Synchronization Royalties $2,666.50 $100.40 $3,235.10 $118.70 21.3% 18.20% PHYSICAL CD - Units Shipped, Millions CD - Dollar Value LP/EP Music Video Other Physical Total Physical Units Total Physical Value 38.6 $443.5 $176.1 $16.4 $4.9 $46.8 $640.8 35.2 $430.6 $181.7 $14.5 $5.3 $43.5 $632.21 -8.6% -2.9% 3.2% -11.3% 10.0% -7.2% -1.3% TOTAL DIGITAL AND PHYSICAL Total Units Total Value 515.1 $3,407.7 402.21 $3,986.0 -21.9% 17.0% % of Shipments 2016 Physical 19.0% Digital 81.0% Note: CD = compact disc; LP = long playing album; EP = extended playing album 20171 16.0% 84.0% EXHIBIT 3: SPOTIFY FUNDING ROUNDS (IN US$) Announced Date Transaction Name Number of Investors Money Raised Lead Investors June 30, 2017 Secondary Market-Spotify 1 July 28, 2016 Secondary Market-Spotify 3 March 30, 2016 Debt Financing-Spotify 2 $1 billion January 27, 2016 Convertible Note-Spotify 1 $500 million January 21, 2016 Secondary Market-Spotify November 1, 2015 Secondary Market-Spotify 1 $150 million August 30, 2015 Secondary Market-Spotify 2 June 10, 2015 Series G-Spotify 16 $526 million November 25, 2014 Secondary Market-Spotify 2 September 1, 2014 Secondary Market-Spotify 1 January 1, 2014 Secondary Market-Spotify 1 November 21, 2013 Series F-Spotify 1 $250 million TCV November 15, 2012 Series E-Spotify 6 $100 million Goldman Sachs January 1, 2012 Secondary Market-Spotify 1 June 17, 2011 Series D-Spotify 5 $100 million Accel Partners February 1, 2010 Series C-Spotify 1 11.6 million Founders Fund August 4, 2009 Series B-Spotify 3 $50 million Horizons Ventures October 1, 2008 Series A-Spotify 5 $21.6 million Source: Adapted from "Spotify Funding Rounds," Crunchbase accessed February 27, 2018, https://www.crunchbase.com/organization/spotify/funding_rounds/funding_rounds_list. EXHIBIT 4: SPOTIFY CONSOLIDATED STATEMENT OF OPERATIONS For the year ended December 31 (in millions, except share and per share data) 2015 2016 2017 1,940 1,714 226 2,952 2.551 401 4,090 3,241 849 Revenue Cost of Revenue Gross Profit Expenses: Research and Development Sales and Marketing General and Administrative Total expenses Operating Loss Finance Income Finance Costs Share in Earnings of Associates and Joint Ventures Finance Incomel (Costs) - net 136 219 106 461 207 368 175 750 396 567 264 1,227 -235 -349 -378 36 -26 152 -336 -2 -186 118 -974 1 -855 10 -225 5 -230 -535 4 -539 -1,233 2 -1,235 Loss Before Tax Income Tax Expense Net Loss Attributable to Owners of the Parent Net Loss per Share Attributable to Owners of the Parent Basic and Diluted Weighted Average Ordinary Shares Outstanding Basic and Diluted -1.62 -3.63 -8.14 141,946,600 148,368, 720 151,668,769 EXHIBIT 5: SPOTIFY BALANCE SHEETS As at December 31 (in millions) 2015 2016 2017 73 85 80 Assets Non-current assets Property and equipment Intangible assets including goodwill Investment in associates and joint ventures Long term investment Restricted cash and other non-current assets Deferred tax assets 81 73 1 0 21 4 180 0 0 23 3 191 162 1 910 54 9 1,209 Current assets Trade and other receivables Income tax receivable Short term investments Cash and cash equivalents Other current assets OW 244 3 0 597 27 871 1,051 300 6 830 755 18 1,909 2,100 360 0 1032 477 29 1,898 3,107 Total assets Equity (Deficit) and liabilities Equity/(Deficit) Share capital Other paid in capital Other reserves Accumulated deficit Equity (Deficit) attributable to owners of the parent 0 797 85 -653 229 0 830 122 -1,192 -240 0 2,488 177 -2,427 238 Non-current liabilities Convertible notes Accrued expenses and other liabilities Provisions Deferred tax liabilities 16 8 AO 000) O 1,106 10 4 0 1,120 Otols 944 56 6 3 1,009 24 04. Current liabilities Trade and other payables Income tax payable Deferred revenue Accrued expenses and other liabilities Provisions Derivative liabilities 119 5 92 485 15 82 798 822 1,051 201 6 149 673 57 134 1,220 2,340 2,100 341 9 216 881 59 354 1,860 2,869 3,107 Total liabilities Total equity/(deficit) and liabilities EXHIBIT 6: SPOTIFY CASH FLOW STATEMENTS For the year ended December 31 (in millions) 2015 2016 2017 -230 -539 -1235 26 46 8 65 Operating activities Net loss Adjustments to reconcile net loss to net cash flows Depreciation of property and equipment Amortization of intangible assets Share-based payments expense Impairment loss on trade receivables Finance income Finance costs Income tax expense Share in earnings of associates and joint ventures Net foreign exchange (gains)losses Changes in working capital: Increase in trade receivables and other assets Increase in trade and other liabilities Increase in deferred revenue Increase in provisions Interest received Interest paid Income tax paid 4 28 0 -36 26 5 0 -33 32 6 53 15 -152 336 4 2 42 0 -118 974 2 -1 -3 N - 121 251 25 20 2 -1 -4 -60 245 77 38 5 -112 447 77 8 19 NOOOOO -4 2 Net cash flows (used in)/from operating activities -38 100 179 -7 -1 -44 -5 0 0 -10 -7 -1 -27 -3 - 1397 609 -1 -49 0 -36 -10 - 1386 1080 -34 -67 -827 -435 Investing activities Business combinations, net of cash acquired Investment in associates and joint ventures Purchases of equipment Purchase of intangibles Purchase of short term investments Sales and maturities of short term investments Change in restricted cash Net cash flows used in investing activities Financing activities Finance lease payments Proceeds from issuance of convertible notes, net of costs Proceeds from issuance of new shares, net of costs Proceeds from issuance of warrants Proceeds from exercise of share options Net cash flow from financing activities Net increase in cash and cash equivalents Cash and cash equivalents at January 1 Net foreign exchange gains/(losses) on cash and cash equivalents -4 -5 4 0 474 861 0 27 33 OOOO 6 29 476 916 34 371 206 190 597 -222 755 20 -32 -56 Cash and cash equivalents at December 31 597 755 477 EXHIBIT 7: SPOTIFY SEGMENT INFORMATION (IN MILLIONS) 2015 2016 2017 Premium Revenue Cost of revenue Gross profit 1,744 1,492 252 2,657 2,228 429 3,674 2,868 806 Ad-Supported Revenue Cost of revenue Gross loss 196 227 -31 295 330 -35 416 373 43 Consolidated Revenue Cost of revenue Gross profit 1,940 1,714 226 2,952 2,551 401 4,090 3,241 849 Reconciliation of gross profit General expenditures, finance income, finance costs, taxes, and share in earnings of associates and joint ventures are not allocated to individual segments as these are managed on an overall group basis. The reconciliation between reportable segment gross profit and loss to consolidated loss before tax is as follows: Segment gross profit Research and development Sales and marketing General and administrative Finance income Finance costs Share in earnings of associates and joint ventures Loss before tax 2015 226 -136 -219 -106 36 -26 2016 401 -207 -368 -175 152 -336 -2 -535 2017 849 -396 -567 -264 118 -974 1 -1233 -225 2015 2016 2017 Revenue by country United States United Kingdom Luxembourg Other countries 741 1,173 268 342 1 1 930 1,436 1,940 2,952 1,577 444 3 2,066 4,090 EXHIBIT 8: NYSE LISTING STANDARDS AND TRADING FOLLOWING IPOS AND DIRECT LISTINGS To list shares for trading on the New York Stock Exchange (NYSE) through a traditional fim-commitment initial public offering (IPO), which involved satisfying requirements of the Securities Act of 1933 and the Securities Exchange Act of 1934, a company had to demonstrate an aggregate market value of publicly held shares of at least US$40 million. That valuation was determined as the offering price in the IPO multiplied by the number of shares to be outstanding after completion of the IPO. The offering price also had to exceed US$4. A firm not previously completing an SEC registered public share offering might also list on the NYSE without contemporaneously selling securities and meeting all related legal requirements, this allowed public trading of shares previously created through private placements. For such "direct listings," the NYSE required a higher minimum number for the aggregate market value of publicly traded shares. The firm had to provide a valuation developed by an independent valuation agent. If the company's unregistered securities actively traded in a trading system for unregistered securities operated by a national securities exchange or registered broker dealer (e.g., a "private placement market" such as SharesPost), the NYSE required that the minimum of the independent agent valuation and the valuation implied from recent transactions in a private placement market be at least US$100 million. Under a NYSE rule change approved February 8, 2018, by the SEC, a firm could list on the NYSE without having recent trading in a private placement market if the independent agent valuation of the firm exceeded US$250 million. The processes through which trading commenced on the NYSE for IPOs and direct listings were similar. Each firm selected a designated market maker (DMM), who was required to set the clearing price for the first trade on the exchange. That clearing price was based on orders to buy and sell received by the DMM. If the DMM anticipated that the clearing price would change by 5 per cent or more from a "reference price," it had to first publish a pre-opening indication of the clearing price to market participants. For traditional IPOs, the reference price was the IPO offering price, for direct offerings, the reference price was the recent price in a private placement market, if one existed, or the number implied by the independent valuation. The DMM might also publish order imbalance information. After publishing the pre-opening indication of the clearing price, it had to wait at least three minutes for the market to react before finalizing the opening price and commencing trading. The DMM could revise the pre-opening indication of a clearing price, in which case the waiting period could be extended. Once the DMM was satisfied that an opening price that would allow orderly clearing of trades had been identified and the requisite waiting period had passed, formal trading could commence. Although market clearing on the first day of trading for IPOs and direct listings looked similar, there were important differences in terms of how the firms got to that first trading day. In an IPO, the issuer retained investment banks to first conduct due diligence and prepare filing documents (S-1s for domestic issuers and F-1s for foreign issuers). Under the Securities Exchange Act of 193, domestic firms pursing a direct listing were required to file Form 10 with the SEC. Foreign firms were required to file Form 20-F(R). Firms could also register under the Securities Act of 1933 using Form S-1 or F-1. The issuer could use an investment bank to help prepare those documents and navigate the SEC approval process, but that was not required. While regulatory filings were being reviewed by the SEC, issuing fimm executives, underwriters, and potential investors met at roadshows. The underwriters solicited indications of interest from investors and gained insights regarding an appropriate price. For a direct offering, there was no roadshow, so a potentially important first step in price discovery was missing. EXHIBIT 8 (CONTINUED) There were two other important differences between IPOs and direct listings that could potentially have an effect on secondary market trading. First, IPOs generally included lockups that precluded certain insiders from trading for some period. Direct IPOs had no lockups, so the number of insiders trading was not limited. The resulting supply and demand imbalances in the early aftermarket could be large and unpredictable. A second important difference related to underwriter stabilization. In an IPO, underwriters were permitted to post stabilizing bids in order to prevent early price declines. Such stabilizing activities were possible for a direct IPO, should the filing firm retain an underwriter, however, the costs savings relative to an IPO could be significantly diminished, given the costs of stabilization and resulting legal liability. Stabilization would be more challenging in a direct offering compared to a traditional IPO, given features of share issuance. To facilitate stabilization in an IPO, the underwriter was permitted to oversell the offering using an overallotment or greenshoe) option. Stabilizing bids could then be covered by the oversold shares. Since direct offerings involved no share sales, it was more costly (and risker) for the underwriter to post stabilizing bids. Note: For an advisor to be considered independent, it could not control more than 5 per cent of the shares of the issuer. The advisor was also required to have not provided any investment banking services to the issuer within the past 12 months. Company Name LTM Total Revenue Alibaba Group Holding Limited Amazon.com, Inc. Apple Inc. Baidu, Inc Comcast Corporation eBay Inc. Facebook, Inc. Netflix, Inc. Pandora Media, Inc. The Walt Disney Company Time Wamer Inc. Twenty-First Century Fox, Inc. Twitter, Inc. Wayfair Inc. EXHIBIT 9: KEY DATA FROM COMPARABLE FIRMS (IN US$) Close Price Shares Market LTM' Net Debt Total Enterprise LTM Tangible (3/28/18) Outstanding Capitalization Value Book Value Share 178.91 2,569.5 459,705.2 -15,074.3 456,971.0 9.38 1,431.42 484.1 692,960.7 13,161.0 706,121.7 22.70 166.48 5,074.0 844,721.7 45,247.0 889,968.7 26.01 223.10 348.2 77,675.0 -11,997.8 68,388.2 42.96 33.28 4,644.5 154,569.2 61, 119.0 217,888.2 -9.97 40.11 1,012.1 40,594.5 4,152.0 44,746.5 3.13 153.03 2,905.0 444,552.3 -41,711.0 402,841.3 18.67 285.77 433.9 124,009.5 3,676.6 127,686.1 - 15.67 4.96 254.9 1,284.2 -227.8 1,5272 0.04 98.54 1,503.7 148,1722 21,414.0 174,522.2 3.29 94 20 779.9 73,4620 21,123.0 94,621.0 -8.49 35.88 1,852.5 66,165.3 13,985.0 82,104.3 -2.15 28.45 748.1 21,284.5 -2,609.4 18,675.1 5.12 65.14 88.5 5,765.1 -204.5 5,560.6 -0.58 36,081.5 177,866.0 239,176.0 13,485.5 84,526.0 9,567.0 40,653.0 11,692.7 1,466.8 55,704.0 31,271.0 29,351.0 2,443.3 4,720.9 LTM EBITDA LTM 1 Year Total Revenues Growth % 14,222.7 57.71% 15,039.0 30.80% 74,174.0 9.65% 4,361.8 20.21% 27,812.0 5.13% 2,941.0 6.55% 23,228.0 47.09% 910.6 32.41% -289.0 5.92% 16,912.0 0.95% 9,081.0 6.66% 6,540.0 4.59% 344.8 -3.41% - 174.2 39.66% NM Company Name LTMEBIT NTM NTM EBITDA 5 Year Beta TEV/Total TE VIEBITDA P/TangBVLTM NTM NTM Margin% Revenue Revenues LTM- LTM - Latest Latest TEV/Forward TE V/Forward Latest Total Revenue EBITDA (Capital IQ) (Capital 10) Alibaba Group Holding Limited 31.30% 50,077.4 21, 196.8 2.58 13.10 44.20 19.70 9.13 21.56 Amazon.com, Inc. 2.30% 233,498.4 26,976.2 1.55 4.00 47.00 63.10 3.02 26.18 Apple Inc 26.90% 263,346.4 80,278.7 1.18 3.70 12.00 6.40 3.38 11.09 Baidu, Inc 18.50% 15,953.0 4,214.0 1.77 5.20 16.30 5.40 4.29 16.23 Comcast Corporation 20.80% 89,550.3 29,456.6 1.16 2.60 7.80 2.43 7.40 eBay Inc. 23.70% 10,962.0 3,721.6 1.06 4.70 15.20 12.80 4.08 12.02 Facebook, Inc. 49.70% 55,284.6 33,601.3 0.66 9.90 17.30 8.20 7.29 11.99 Netflix, Inc. 7.20% 15,862.5 1,923.0 0.96 10.90 140.20 NM 8.05 66.40 Pandora Media, Inc. -23.00% 1,505.8 -98.2 -0.40 1.00 0.00 111.40 NM The Walt Disney Company 25. 30% 58,771.3 17,847.8 1.31 3.10 10.20 30.00 2.97 9.78 Time Wamer Inc 26.80% 32,566.3 9,448.4 0.92 3.00 10.60 NM 2.91 10.01 Twenty-First Century Fox, Inc. 20.40% 31,296.1 7,492.9 1.26 2.80 12.60 NM 2.62 10.96 Twitter, Inc. 1.90% 2,704.5 964.7 0.80 7.60 54.20 5.60 6.91 19.36 Wayfair Inc. -4.80% 6,242.3 -99.1 1.27 1.20 0.00 NM 0.89 NM Notes: 'LTM = last 12 months; EBITDA = eamings before interest, taxes, depreciation, and amortization; 2 Tangible book value = assets, net of goodwill and other intangibles, less liabilities; NTM = next 12 months; NTM financials were consensus (average) analyst forecasts as compiled by Standard & Poor's Capital 10: NM = not measurable. 1.01 EXHIBIT 10: ADDITIONAL DISCOUNTED CASH FLOW ASSUMPTIONS Year EBIT Margin* Capital Expenditures Less Depreciation Plus Increases in Working Capital** 2018 2019 2020 2021 2022 2023 2024 2025 2026 2027 -2.08% -0.41% 1.26% 2.94% 4.61% 6.28% 7.95% 9.63% 11.30% 12.97% 255.63 319.53 399.41 499.27 624.08 624.08 561.68 473.68 382.39 258.11 Notes: EBIT = earnings before interest and taxes; * EBIT as a percentage of revenue, as assumed in Damodaran's model; negative margins in 2018 and 2019; ** in milions; as indicated in Damodaran's model as "reinvestment" in order to preserve the sales-to-capital ratio at 4.0. EXHIBIT 2: RECORDING INDUSTRY ASSOCIATION OF AMERICA STATISTICS United States Estimated Retail Dollar Value (In US$ millions, net after returns) DIGITAL SUBSCRIPTION & STREAMING Paid Subscription-Units, Millions Paid Subscription-Dollar Value Limited Tier Paid Subscription On-Demand Streaming (Ad-Supported) SoundExchange Distributions Other Ad-Supported Streaming Total Streaming Revenues 2016 20.2 $994.9 $71.7 $199.31 $403.4 $3.7 $1,673.0 2017 30.4 $1,487.7 $224.7 $273.21 $339.5 $153.1 $2,478.1 % CHANGE 2016-2017 50.60% 49.50% 213.40% 37.10% - 15.80% 4021.20% 48.10% DIGITAL PERMANENT DOWNLOAD Download Single-Units, Millions Download Single-Dollar Value Download Album Ringtones & Ringbacks Other Digital Total Digital Download Revenues 412.5 $496.6 $464.61 $21.4 $10.9 $993.5 316.21 $384.6 $344.1 $16.7 $11.71 $757.0 -23.4% -22.6% -25.9% 22.0% 7.3% -23.8% TOTAL DIGITAL VALUE Synchronization Royalties $2,666.50 $100.40 $3,235.10 $118.70 21.3% 18.20% PHYSICAL CD - Units Shipped, Millions CD - Dollar Value LP/EP Music Video Other Physical Total Physical Units Total Physical Value 38.6 $443.5 $176.1 $16.4 $4.9 $46.8 $640.8 35.2 $430.6 $181.7 $14.5 $5.3 $43.5 $632.21 -8.6% -2.9% 3.2% -11.3% 10.0% -7.2% -1.3% TOTAL DIGITAL AND PHYSICAL Total Units Total Value 515.1 $3,407.7 402.21 $3,986.0 -21.9% 17.0% % of Shipments 2016 Physical 19.0% Digital 81.0% Note: CD = compact disc; LP = long playing album; EP = extended playing album 20171 16.0% 84.0% EXHIBIT 3: SPOTIFY FUNDING ROUNDS (IN US$) Announced Date Transaction Name Number of Investors Money Raised Lead Investors June 30, 2017 Secondary Market-Spotify 1 July 28, 2016 Secondary Market-Spotify 3 March 30, 2016 Debt Financing-Spotify 2 $1 billion January 27, 2016 Convertible Note-Spotify 1 $500 million January 21, 2016 Secondary Market-Spotify November 1, 2015 Secondary Market-Spotify 1 $150 million August 30, 2015 Secondary Market-Spotify 2 June 10, 2015 Series G-Spotify 16 $526 million November 25, 2014 Secondary Market-Spotify 2 September 1, 2014 Secondary Market-Spotify 1 January 1, 2014 Secondary Market-Spotify 1 November 21, 2013 Series F-Spotify 1 $250 million TCV November 15, 2012 Series E-Spotify 6 $100 million Goldman Sachs January 1, 2012 Secondary Market-Spotify 1 June 17, 2011 Series D-Spotify 5 $100 million Accel Partners February 1, 2010 Series C-Spotify 1 11.6 million Founders Fund August 4, 2009 Series B-Spotify 3 $50 million Horizons Ventures October 1, 2008 Series A-Spotify 5 $21.6 million Source: Adapted from "Spotify Funding Rounds," Crunchbase accessed February 27, 2018, https://www.crunchbase.com/organization/spotify/funding_rounds/funding_rounds_list. EXHIBIT 4: SPOTIFY CONSOLIDATED STATEMENT OF OPERATIONS For the year ended December 31 (in millions, except share and per share data) 2015 2016 2017 1,940 1,714 226 2,952 2.551 401 4,090 3,241 849 Revenue Cost of Revenue Gross Profit Expenses: Research and Development Sales and Marketing General and Administrative Total expenses Operating Loss Finance Income Finance Costs Share in Earnings of Associates and Joint Ventures Finance Incomel (Costs) - net 136 219 106 461 207 368 175 750 396 567 264 1,227 -235 -349 -378 36 -26 152 -336 -2 -186 118 -974 1 -855 10 -225 5 -230 -535 4 -539 -1,233 2 -1,235 Loss Before Tax Income Tax Expense Net Loss Attributable to Owners of the Parent Net Loss per Share Attributable to Owners of the Parent Basic and Diluted Weighted Average Ordinary Shares Outstanding Basic and Diluted -1.62 -3.63 -8.14 141,946,600 148,368, 720 151,668,769 EXHIBIT 5: SPOTIFY BALANCE SHEETS As at December 31 (in millions) 2015 2016 2017 73 85 80 Assets Non-current assets Property and equipment Intangible assets including goodwill Investment in associates and joint ventures Long term investment Restricted cash and other non-current assets Deferred tax assets 81 73 1 0 21 4 180 0 0 23 3 191 162 1 910 54 9 1,209 Current assets Trade and other receivables Income tax receivable Short term investments Cash and cash equivalents Other current assets OW 244 3 0 597 27 871 1,051 300 6 830 755 18 1,909 2,100 360 0 1032 477 29 1,898 3,107 Total assets Equity (Deficit) and liabilities Equity/(Deficit) Share capital Other paid in capital Other reserves Accumulated deficit Equity (Deficit) attributable to owners of the parent 0 797 85 -653 229 0 830 122 -1,192 -240 0 2,488 177 -2,427 238 Non-current liabilities Convertible notes Accrued expenses and other liabilities Provisions Deferred tax liabilities 16 8 AO 000) O 1,106 10 4 0 1,120 Otols 944 56 6 3 1,009 24 04. Current liabilities Trade and other payables Income tax payable Deferred revenue Accrued expenses and other liabilities Provisions Derivative liabilities 119 5 92 485 15 82 798 822 1,051 201 6 149 673 57 134 1,220 2,340 2,100 341 9 216 881 59 354 1,860 2,869 3,107 Total liabilities Total equity/(deficit) and liabilities EXHIBIT 6: SPOTIFY CASH FLOW STATEMENTS For the year ended December 31 (in millions) 2015 2016 2017 -230 -539 -1235 26 46 8 65 Operating activities Net loss Adjustments to reconcile net loss to net cash flows Depreciation of property and equipment Amortization of intangible assets Share-based payments expense Impairment loss on trade receivables Finance income Finance costs Income tax expense Share in earnings of associates and joint ventures Net foreign exchange (gains)losses Changes in working capital: Increase in trade receivables and other assets Increase in trade and other liabilities Increase in deferred revenue Increase in provisions Interest received Interest paid Income tax paid 4 28 0 -36 26 5 0 -33 32 6 53 15 -152 336 4 2 42 0 -118 974 2 -1 -3 N - 121 251 25 20 2 -1 -4 -60 245 77 38 5 -112 447 77 8 19 NOOOOO -4 2 Net cash flows (used in)/from operating activities -38 100 179 -7 -1 -44 -5 0 0 -10 -7 -1 -27 -3 - 1397 609 -1 -49 0 -36 -10 - 1386 1080 -34 -67 -827 -435 Investing activities Business combinations, net of cash acquired Investment in associates and joint ventures Purchases of equipment Purchase of intangibles Purchase of short term investments Sales and maturities of short term investments Change in restricted cash Net cash flows used in investing activities Financing activities Finance lease payments Proceeds from issuance of convertible notes, net of costs Proceeds from issuance of new shares, net of costs Proceeds from issuance of warrants Proceeds from exercise of share options Net cash flow from financing activities Net increase in cash and cash equivalents Cash and cash equivalents at January 1 Net foreign exchange gains/(losses) on cash and cash equivalents -4 -5 4 0 474 861 0 27 33 OOOO 6 29 476 916 34 371 206 190 597 -222 755 20 -32 -56 Cash and cash equivalents at December 31 597 755 477 EXHIBIT 7: SPOTIFY SEGMENT INFORMATION (IN MILLIONS) 2015 2016 2017 Premium Revenue Cost of revenue Gross profit 1,744 1,492 252 2,657 2,228 429 3,674 2,868 806 Ad-Supported Revenue Cost of revenue Gross loss 196 227 -31 295 330 -35 416 373 43 Consolidated Revenue Cost of revenue Gross profit 1,940 1,714 226 2,952 2,551 401 4,090 3,241 849 Reconciliation of gross profit General expenditures, finance income, finance costs, taxes, and share in earnings of associates and joint ventures are not allocated to individual segments as these are managed on an overall group basis. The reconciliation between reportable segment gross profit and loss to consolidated loss before tax is as follows: Segment gross profit Research and development Sales and marketing General and administrative Finance income Finance costs Share in earnings of associates and joint ventures Loss before tax 2015 226 -136 -219 -106 36 -26 2016 401 -207 -368 -175 152 -336 -2 -535 2017 849 -396 -567 -264 118 -974 1 -1233 -225 2015 2016 2017 Revenue by country United States United Kingdom Luxembourg Other countries 741 1,173 268 342 1 1 930 1,436 1,940 2,952 1,577 444 3 2,066 4,090 EXHIBIT 8: NYSE LISTING STANDARDS AND TRADING FOLLOWING IPOS AND DIRECT LISTINGS To list shares for trading on the New York Stock Exchange (NYSE) through a traditional fim-commitment initial public offering (IPO), which involved satisfying requirements of the Securities Act of 1933 and the Securities Exchange Act of 1934, a company had to demonstrate an aggregate market value of publicly held shares of at least US$40 million. That valuation was determined as the offering price in the IPO multiplied by the number of shares to be outstanding after completion of the IPO. The offering price also had to exceed US$4. A firm not previously completing an SEC registered public share offering might also list on the NYSE without contemporaneously selling securities and meeting all related legal requirements, this allowed public trading of shares previously created through private placements. For such "direct listings," the NYSE required a higher minimum number for the aggregate market value of publicly traded shares. The firm had to provide a valuation developed by an independent valuation agent. If the company's unregistered securities actively traded in a trading system for unregistered securities operated by a national securities exchange or registered broker dealer (e.g., a "private placement market" such as SharesPost), the NYSE required that the minimum of the independent agent valuation and the valuation implied from recent transactions in a private placement market be at least US$100 million. Under a NYSE rule change approved February 8, 2018, by the SEC, a firm could list on the NYSE without having recent trading in a private placement market if the independent agent valuation of the firm exceeded US$250 million. The processes through which trading commenced on the NYSE for IPOs and direct listings were similar. Each firm selected a designated market maker (DMM), who was required to set the clearing price for the first trade on the exchange. That clearing price was based on orders to buy and sell received by the DMM. If the DMM anticipated that the clearing price would change by 5 per cent or more from a "reference price," it had to first publish a pre-opening indication of the clearing price to market participants. For traditional IPOs, the reference price was the IPO offering price, for direct offerings, the reference price was the recent price in a private placement market, if one existed, or the number implied by the independent valuation. The DMM might also publish order imbalance information. After publishing the pre-opening indication of the clearing price, it had to wait at least three minutes for the market to react before finalizing the opening price and commencing trading. The DMM could revise the pre-opening indication of a clearing price, in which case the waiting period could be extended. Once the DMM was satisfied that an opening price that would allow orderly clearing of trades had been identified and the requisite waiting period had passed, formal trading could commence. Although market clearing on the first day of trading for IPOs and direct listings looked similar, there were important differences in terms of how the firms got to that first trading day. In an IPO, the issuer retained investment banks to first conduct due diligence and prepare filing documents (S-1s for domestic issuers and F-1s for foreign issuers). Under the Securities Exchange Act of 193, domestic firms pursing a direct listing were required to file Form 10 with the SEC. Foreign firms were required to file Form 20-F(R). Firms could also register under the Securities Act of 1933 using Form S-1 or F-1. The issuer could use an investment bank to help prepare those documents and navigate the SEC approval process, but that was not required. While regulatory filings were being reviewed by the SEC, issuing fimm executives, underwriters, and potential investors met at roadshows. The underwriters solicited indications of interest from investors and gained insights regarding an appropriate price. For a direct offering, there was no roadshow, so a potentially important first step in price discovery was missing. EXHIBIT 8 (CONTINUED) There were two other important differences between IPOs and direct listings that could potentially have an effect on secondary market trading. First, IPOs generally included lockups that precluded certain insiders from trading for some period. Direct IPOs had no lockups, so the number of insiders trading was not limited. The resulting supply and demand imbalances in the early aftermarket could be large and unpredictable. A second important difference related to underwriter stabilization. In an IPO, underwriters were permitted to post stabilizing bids in order to prevent early price declines. Such stabilizing activities were possible for a direct IPO, should the filing firm retain an underwriter, however, the costs savings relative to an IPO could be significantly diminished, given the costs of stabilization and resulting legal liability. Stabilization would be more challenging in a direct offering compared to a traditional IPO, given features of share issuance. To facilitate stabilization in an IPO, the underwriter was permitted to oversell the offering using an overallotment or greenshoe) option. Stabilizing bids could then be covered by the oversold shares. Since direct offerings involved no share sales, it was more costly (and risker) for the underwriter to post stabilizing bids. Note: For an advisor to be considered independent, it could not control more than 5 per cent of the shares of the issuer. The advisor was also required to have not provided any investment banking services to the issuer within the past 12 months. Company Name LTM Total Revenue Alibaba Group Holding Limited Amazon.com, Inc. Apple Inc. Baidu, Inc Comcast Corporation eBay Inc. Facebook, Inc. Netflix, Inc. Pandora Media, Inc. The Walt Disney Company Time Wamer Inc. Twenty-First Century Fox, Inc. Twitter, Inc. Wayfair Inc. EXHIBIT 9: KEY DATA FROM COMPARABLE FIRMS (IN US$) Close Price Shares Market LTM' Net Debt Total Enterprise LTM Tangible (3/28/18) Outstanding Capitalization Value Book Value Share 178.91 2,569.5 459,705.2 -15,074.3 456,971.0 9.38 1,431.42 484.1 692,960.7 13,161.0 706,121.7 22.70 166.48 5,074.0 844,721.7 45,247.0 889,968.7 26.01 223.10 348.2 77,675.0 -11,997.8 68,388.2 42.96 33.28 4,644.5 154,569.2 61, 119.0 217,888.2 -9.97 40.11 1,012.1 40,594.5 4,152.0 44,746.5 3.13 153.03 2,905.0 444,552.3 -41,711.0 402,841.3 18.67 285.77 433.9 124,009.5 3,676.6 127,686.1 - 15.67 4.96 254.9 1,284.2 -227.8 1,5272 0.04 98.54 1,503.7 148,1722 21,414.0 174,522.2 3.29 94 20 779.9 73,4620 21,123.0 94,621.0 -8.49 35.88 1,852.5 66,165.3 13,985.0 82,104.3 -2.15 28.45 748.1 21,284.5 -2,609.4 18,675.1 5.12 65.14 88.5 5,765.1 -204.5 5,560.6 -0.58 36,081.5 177,866.0 239,176.0 13,485.5 84,526.0 9,567.0 40,653.0 11,692.7 1,466.8 55,704.0 31,271.0 29,351.0 2,443.3 4,720.9 LTM EBITDA LTM 1 Year Total Revenues Growth % 14,222.7 57.71% 15,039.0 30.80% 74,174.0 9.65% 4,361.8 20.21% 27,812.0 5.13% 2,941.0 6.55% 23,228.0 47.09% 910.6 32.41% -289.0 5.92% 16,912.0 0.95% 9,081.0 6.66% 6,540.0 4.59% 344.8 -3.41% - 174.2 39.66% NM Company Name LTMEBIT NTM NTM EBITDA 5 Year Beta TEV/Total TE VIEBITDA P/TangBVLTM NTM NTM Margin% Revenue Revenues LTM- LTM - Latest Latest TEV/Forward TE V/Forward Latest Total Revenue EBITDA (Capital IQ) (Capital 10) Alibaba Group Holding Limited 31.30% 50,077.4 21, 196.8 2.58 13.10 44.20 19.70 9.13 21.56 Amazon.com, Inc. 2.30% 233,498.4 26,976.2 1.55 4.00 47.00 63.10 3.02 26.18 Apple Inc 26.90% 263,346.4 80,278.7 1.18 3.70 12.00 6.40 3.38 11.09 Baidu, Inc 18.50% 15,953.0 4,214.0 1.77 5.20 16.30 5.40 4.29 16.23 Comcast Corporation 20.80% 89,550.3 29,456.6 1.16 2.60 7.80 2.43 7.40 eBay Inc. 23.70% 10,962.0 3,721.6 1.06 4.70 15.20 12.80 4.08 12.02 Facebook, Inc. 49.70% 55,284.6 33,601.3 0.66 9.90 17.30 8.20 7.29 11.99 Netflix, Inc. 7.20% 15,862.5 1,923.0 0.96 10.90 140.20 NM 8.05 66.40 Pandora Media, Inc. -23.00% 1,505.8 -98.2 -0.40 1.00 0.00 111.40 NM The Walt Disney Company 25. 30% 58,771.3 17,847.8 1.31 3.10 10.20 30.00 2.97 9.78 Time Wamer Inc 26.80% 32,566.3 9,448.4 0.92 3.00 10.60 NM 2.91 10.01 Twenty-First Century Fox, Inc. 20.40% 31,296.1 7,492.9 1.26 2.80 12.60 NM 2.62 10.96 Twitter, Inc. 1.90% 2,704.5 964.7 0.80 7.60 54.20 5.60 6.91 19.36 Wayfair Inc. -4.80% 6,242.3 -99.1 1.27 1.20 0.00 NM 0.89 NM Notes: 'LTM = last 12 months; EBITDA = eamings before interest, taxes, depreciation, and amortization; 2 Tangible book value = assets, net of goodwill and other intangibles, less liabilities; NTM = next 12 months; NTM financials were consensus (average) analyst forecasts as compiled by Standard & Poor's Capital 10: NM = not measurable. 1.01 EXHIBIT 10: ADDITIONAL DISCOUNTED CASH FLOW ASSUMPTIONS Year EBIT Margin* Capital Expenditures Less Depreciation Plus Increases in Working Capital** 2018 2019 2020 2021 2022 2023 2024 2025 2026 2027 -2.08% -0.41% 1.26% 2.94% 4.61% 6.28% 7.95% 9.63% 11.30% 12.97% 255.63 319.53 399.41 499.27 624.08 624.08 561.68 473.68 382.39 258.11 Notes: EBIT = earnings before interest and taxes; * EBIT as a percentage of revenue, as assumed in Damodaran's model; negative margins in 2018 and 2019; ** in milions; as indicated in Damodaran's model as "reinvestment" in order to preserve the sales-to-capital ratio at 4.0