Question
1. Vector Review Draw each of the following vectors then find its x- and y-components. Vector d = (100 m, 45 degrees below +x-axis) Vector
1. Vector Review
Draw each of the following vectors then find its x- and y-components.
- Vector d = (100 m, 45 degrees below +x-axis)
- Vector v = (300 m/s, 20 degrees above +x-axis
- Vector a = (5.0 m/s2, -y-direction)
2. Hurricane's Path
A hurricane's path is tracked using Doppler RADAR by three weather stations. Hurricanes do not always travel in straight lines but instead move in erratic patterns determined by weather conditions and surface features. At t = 0 s the hurricane passes the first weather station, at t = 14 minutes the hurricane passes the second weather station, and at t = 30 minutes the hurricane passes the third weather station. The second station is location 10 km away from the first station 39 north of east. The third station is located 16 km from the second station 10 south of east.
- Sketch a diagram of this situation.
- What is the total distance traveled by the hurricane in the stated 30 minutes?
- When the hurricane reaches the third weather station, how far is it from where it started?
- Is the hurricane moving at a constant speed? How do you know?
3. Graphing Two-Dimensional Motion
A speedboat moves on a lake with initial velocity vector vix = 5.00 m/s and viy = -2.50 m/s, then accelerates for 5.00 seconds at a constant acceleration of ax = -1.00 m/s2 and ay = 1.00 m/s2.
- Sketch a graph of the x component of the speedboat's acceleration as a function of time. Start at t = 0 s and end at t = 5.00 s.
- Sketch a graph of the y component of the speedboat's acceleration as a function of time. Start at t = 0 s and end at t = 5.00 s.
- Sketch a graph of the x component of the speedboat's velocity as a function of time. Start at t = 0 s and end at t = 5.00 s.
- Sketch a graph of the y component of the speedboat's velocity as a function of time. Start at t = 0 s and end at t = 5.00 s.
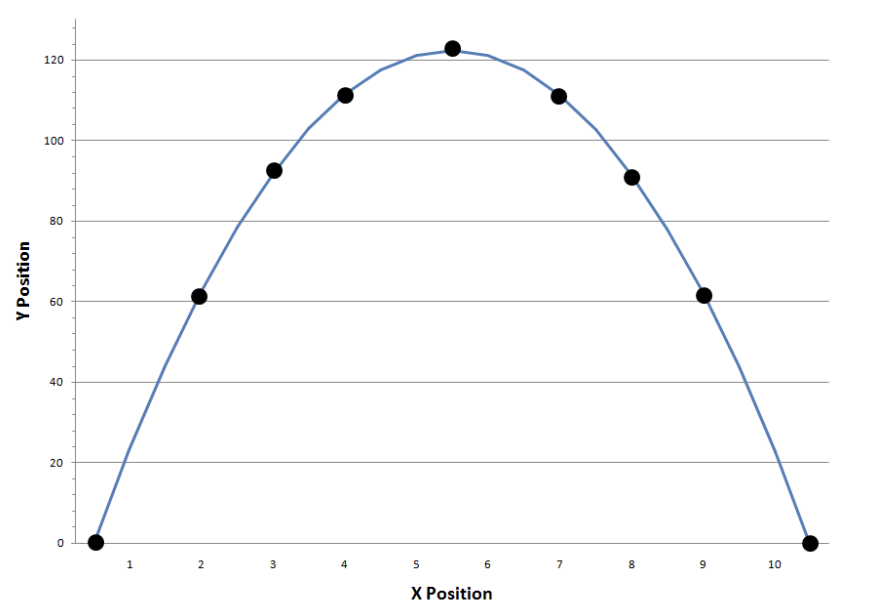
4. Poorly Thrown Football
In the figure below is shown the trajectory for a football as it moves through the air. At the points indicated, draw the following vectors:
- x component of the velocity.
- y component of the velocity.
- the acceleration.

120 100 Y Position 80 60 10 40 20 0 1 2 3 5 6 X Position 7 6 10
Step by Step Solution
There are 3 Steps involved in it
Step: 1

Get Instant Access to Expert-Tailored Solutions
See step-by-step solutions with expert insights and AI powered tools for academic success
Step: 2

Step: 3

Ace Your Homework with AI
Get the answers you need in no time with our AI-driven, step-by-step assistance
Get Started


