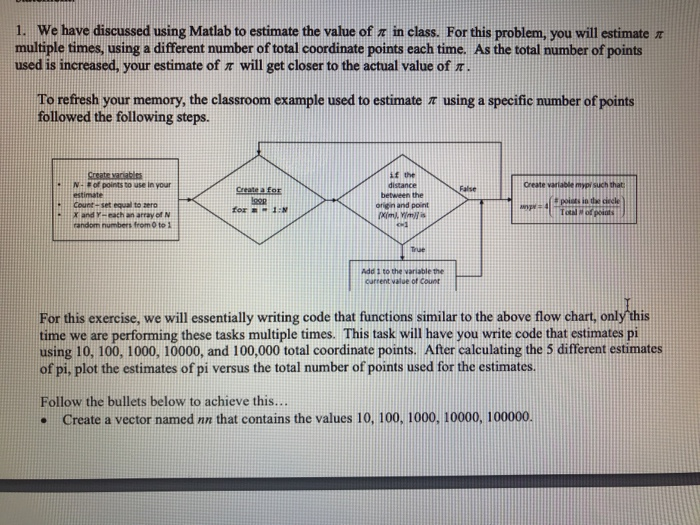
1. we have discussed using Matlab to estimate the value of in class. For this problem, you will estimate multiple times, using a different number of total coordinate points each time. As the total number of points used is increased, your estimate of r will get closer to the actual value of n To refresh your memory, the classroom example used to estimate using a specific number ofpoints followed the following steps. N. F of points to use in your estimate Count-set equal to zero x and Y-each an array of N random numbers from 0 to 1 if the distance between the origin and point Create a for False mypy such that for 1 True Add 1 to the variable the ourrent value of Count For this exercise, we will essentially writing code that functions similar to the above flow chart, only this time we are performing these tasks multiple times. This task will have you write code that estimates pi using 10, 100, 1000, 10000, and 100,000 total coordinate points. After calculating the 5 different estimates of pi, plot the estimates of pi versus the total number of points used for the estimates. Follow the bullets below to achieve this... . Create a vector named nn that contains the values 10, 100, 1000, 10000, 100000. Create a vector mypi that will be used to save your estimate of pi for each point total saved in nn. Create a for loop to iterate through each value of nn. This means you will have to create a loop variable. o Create two vectors X and Y of random numbers between 0 and 1 that have a total number of points equal to the current value in nn. Make it such that as the index of your loop progresses through the elements of nn, it overwrites the values of X and Y. (In this case, it is ok to have your vectors change size in your loop. We are only running this loop 5 times, so we aren't concerned with efficiency.) o Create a variable count and set the value equal to 0 o Create another for loop to iterate through each element in X and Y to obtain the total number of coordinate pairs that lie within the circle. (A new loop variable will be needed...) o For each coordinate pair in X and Y, check to see if it falls within the unit circle. If it does, increase count by one. o Calculate your current estimate of mypi. Your estimate should be saved in the element of mypi that corresponds to the current number of points being used in nn (i.e. the current element in nn). Outside all loops, display the value of your vector mypi. (This should only print to your Command Window once...) Create a figure Plot mypi (y-axis) versus nn (x-axis) with a line to indicate the true value of pi... Since our x coordinates are widely spaced, it is easier to view this using what is called a "logarithmic scale". We can do this using the semilogx function, which works just like the plot function, so we can replace the "plot" in our usual code with semi logx" o Use the semilogx function to plot mypi versus nn using a line with circles to mark the data points. (DO NOT use the plot command...) o On the same plot, insert a dotted line on the chart to indicate the true value of pi. This can be accomplished by the following command: " semilogx ([min (nn) max (nn)], pi pil, o Label the axes accordingly and title the figure as "Problem Set 2, No. I - Estimate Pi o Set the limits of the y-axis between 0 and 4, using the ylim command. STOP.. If your code for this exercise does not contain 2 loops and I if statement, then you have not followed directions