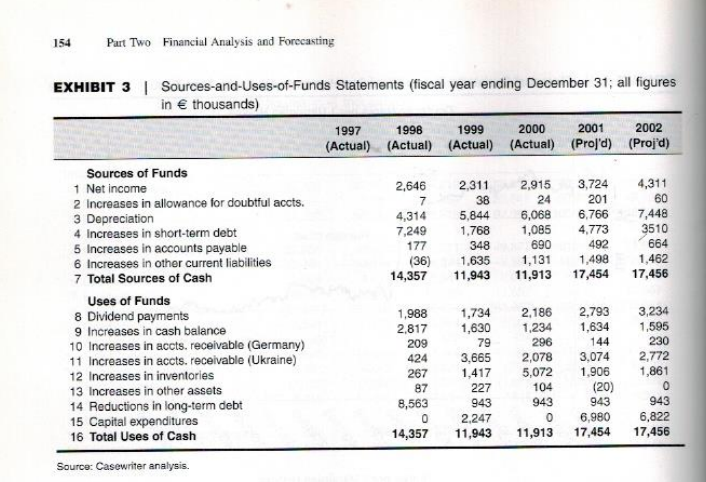
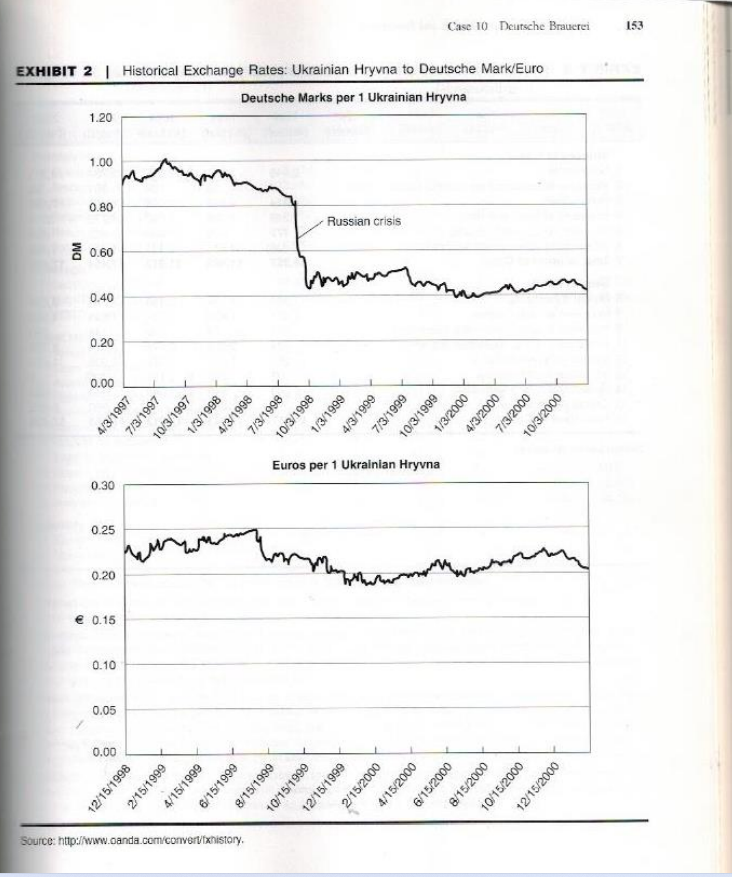
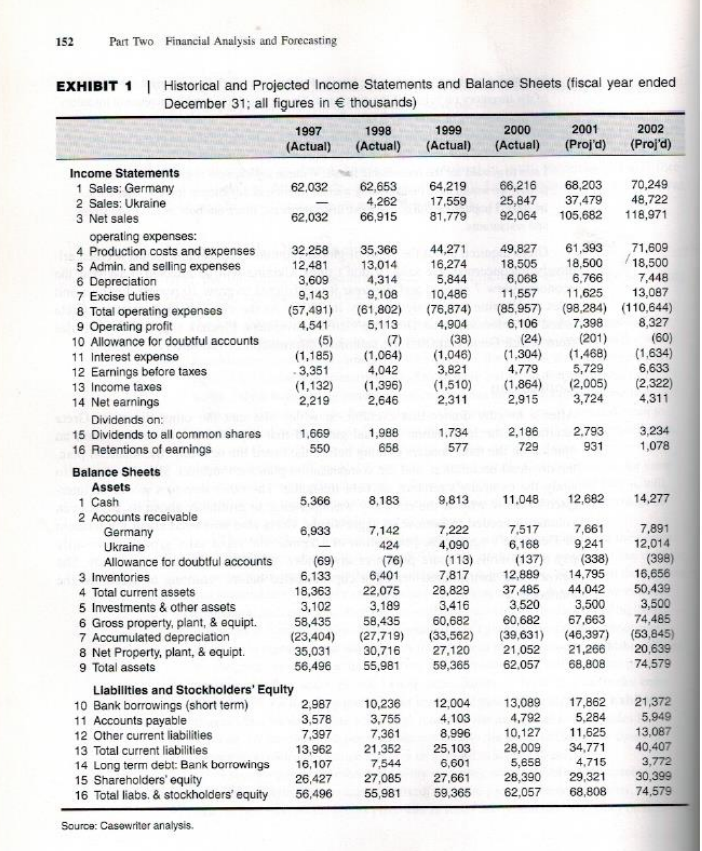
1. What accounts for Deutsche Brauereis rapid growth in recent years? Specifically, what policy choices account for this success? How does this company make money? What is its strategy? 2. How has the company been doing? What does the break-even chart tell us? 3. What do the financial forecast and the sources-and-uses-of-funds statement tell us? How about the financial ratios? 4. Why does this profitable firm need increasing amounts of bank debt? 5. What is Deutsche Brauereis credit policy toward its distributors in Ukraine? Why is it different from the policy toward its other distributors? 6. Is the companys credit policy appropriate? Is it profitable? If not, how would you change it? If so, what arguments would you offer to the board of directors in its defense? 7. As a member of the board of directors, how would you vote on: a. The proposed raise for Oleg Pinchuk? b. The quarterly dividend declaration of EUR698,000? c. Adoption of the financial plan for 2001?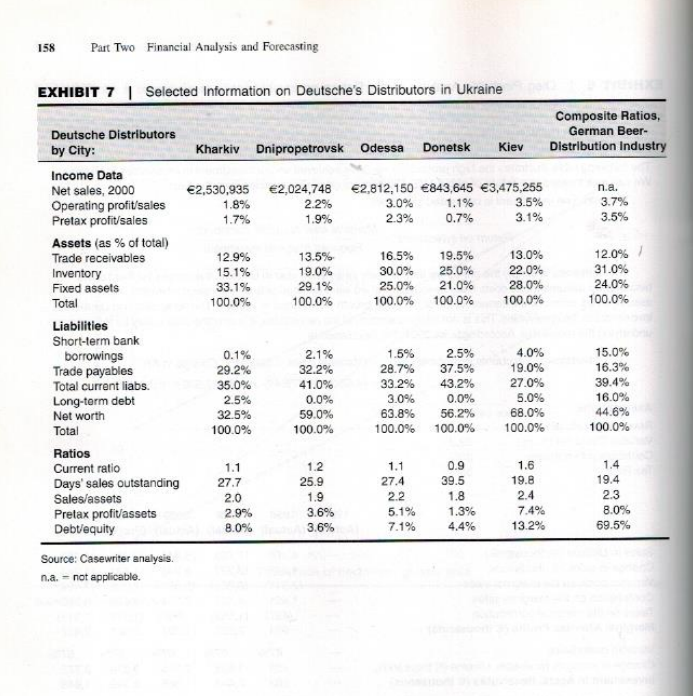
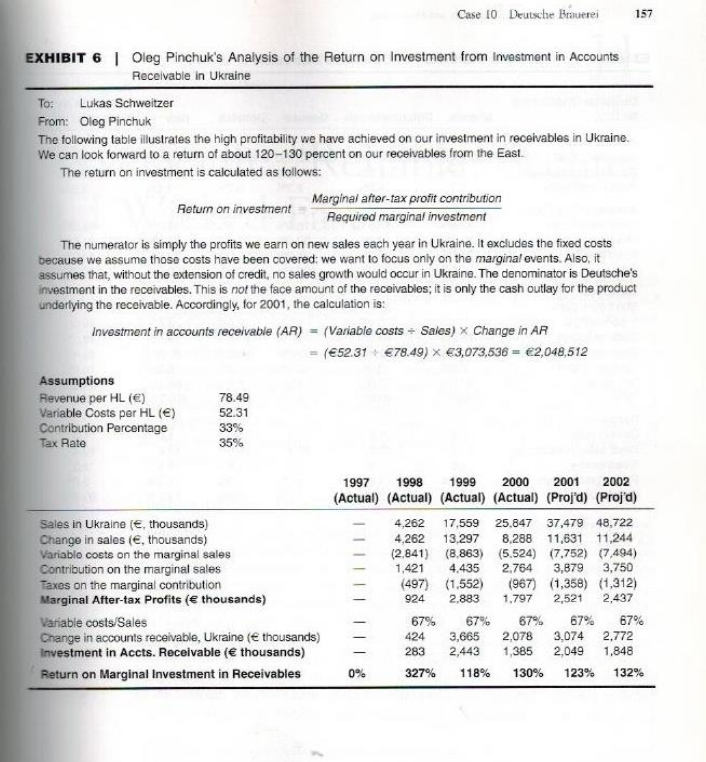
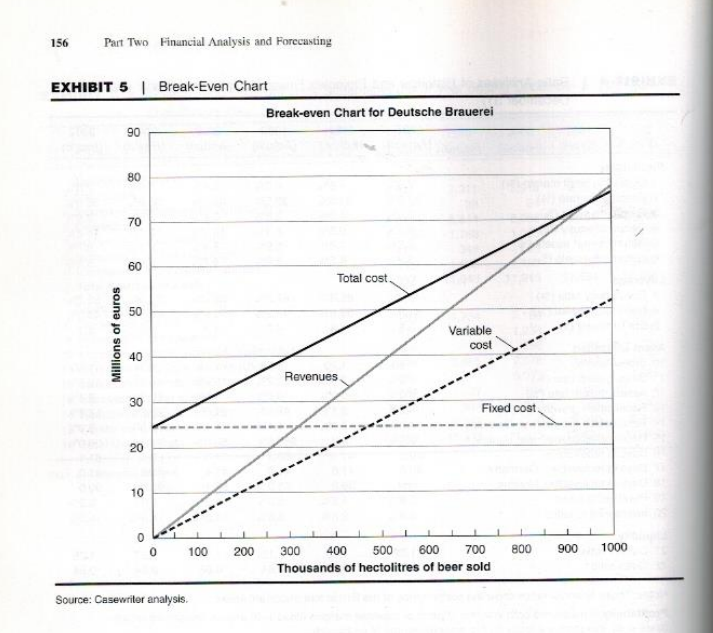
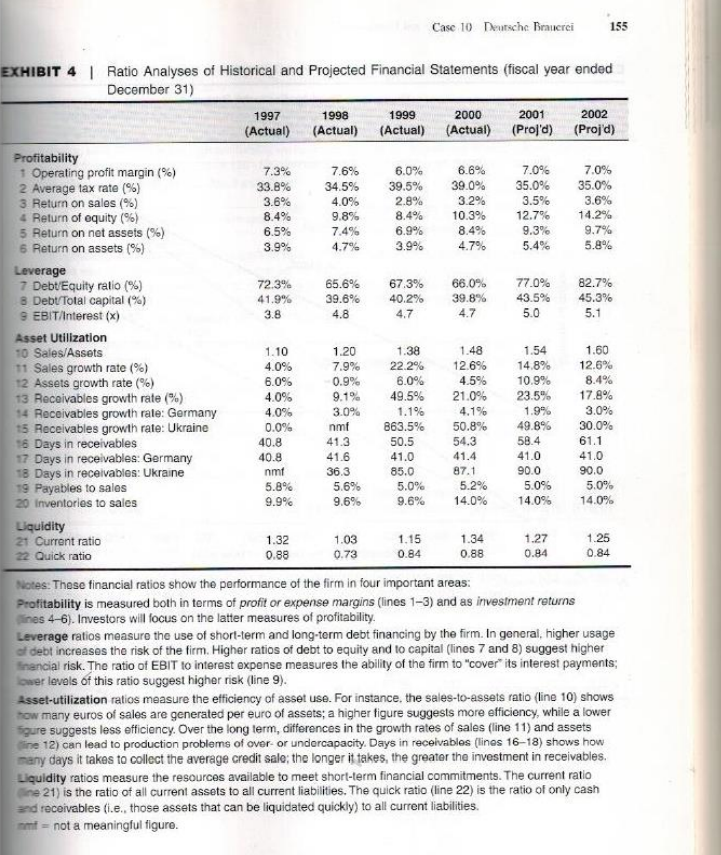
158 Part Two Financial Analysis and Forecasting EXHIBIT 7 Selected Information on Deutsche's Distributors in Ukraine Composite Ratios, German Beer- Distribution Industry Kharkiv Dnipropetrovsk Odessa Donetsk Kiev 2,530,935 1.8% 1.7% 2,024,748 2.2% 1.9% 2,812,150 843,645 3,475,255 3.0% 1.1% 3.5% 2.3% 0.7% 3.1% n.a. 3.7% 3.5% 12.9% 15.1% 33.1% 100.0% 13.5% 19.0% 29.1% 100.0% 16.5% 30.0% 25.0% 100.0% 19.5% 25.0% 21.0% 100.0% 13.0% 22.0% 28.0% 100.0% 12.0% 31.0% 24.0% 100.0% Deutsche Distributors by City: Income Data Net sales, 2000 Operating profit/sales Pretax profit/sales Assets (as % of total) Trade receivables Inventory Fixed assets Total Liabilities Short-term bank borrowings Trade payables Total current liabs. Long-term debt Net worth Total Ratios Current ratio Days' sales outstanding Sales/assets Pretax profit/assets Debt/equity 0.1% 29.2% 35.0% 2.5% 32.5% 100.0% 2.1% 32.2% 41.0% 0.0% 59.0% 100.0% 1.5% 28.7% 33.2% 3.0% 63.8% 100.0% 2.5% 37.5% 43.2% 0.0% 56.2% 100.0% 4.0% 19.0% 27.0% 5.0% 68.0% 100.0% 15.0% 16.3% 39.4% 16.0% 44.6% 100.0% 1.1 27.7 2.0 2.99 8.0% 1.2 25.9 1.9 3.6% 3.6% 1.1 27.4 2.2. 5.1% 7.1% 0.9 39.5 1.8 1.3% 4.4% 1.6 19.8 2.4 7.4% 13.2% 1.4 19.4 2.3 8.0% 69.5% Source: Casewriter analysis. n.a. - not applicable Case 10 Deutsche Brauerei 157 EXHIBIT 6 | Oleg Pinchuk's Analysis of the Return on Investment from Investment in Accounts Receivable in Ukraine To: Lukas Schweitzer From: Oleg Pinchuk The following table illustrates the high profitability we have achieved on our investment in receivables in Ukraine. We can look forward to a return of about 120-130 percent on our receivables from the East. The return on investment is calculated as follows: Return on investment Marginal after-tax profit contribution Required marginal investment The numerator is simply the profits we earn on new sales each year in Ukraine. It excludes the fixed costs because we assume those costs have been covered: we want to focus only on the marginal events. Also, it assumes that, without the extension of credit, no sales growth would occur in Ukraine. The denominator is Deutsche's investment in the receivables. This is not the face amount of the receivablos; it is only the cash outlay for the product underlying the receivable. Accordingly, for 2001, the calculation is: Investment in accounts receivable (AR) = (Variable costs - Sales) Change in AR = (52.31 78.49) 3,073,536 - 2,048,512 Assumptions Revenue per HL () 78.49 Variable Costs per HL () 52.31 Contribution Percentage 33% Tax Rate 35% Sales in Ukraine (, thousands) Change in sales (, thousands) Variable costs on the marginal sales Contribution on the marginal sales Taxes on the marginal contribution Marginal After-tax Profits ( thousands) Variable costs/Sales Change in accounts receivable, Ukraine ( thousands) Investment in Accts. Receivable ( thousands) Return on Marginal Investment in Receivables 1997 1998 1999 2000 2001 2002 (Actual) (Actual) (Actual) (Actual) (Projd) (Projd) 4,262 17.559 25.847 37,479 48,722 4,262 13.297 8.288 11,631 11,244 (2.841) (8.863) (5.524) (7.752) (7.494) 1,421 4,435 2.764 3,879 3,750 (497) (1.552) (967) (1,358) (1,312) 924 2.883 1.797 2,521 2,437 67% 67% 67% 67% 67% 424 3,665 2,078 3,074 2.772 283 2.443 1,385 2,049 1,848 0% 327% 118% 130% 123% 132% 156 Part Two Financial Analysis and Forecasting EXHIBIT 5 Break-Even Chart Break-even Chart for Deutsche Brauerei 90 80 70 60 Total cost. 50 Millions of euros Variable cost 40 Revenues 30 Fixed cost 20 10 0 100 200 800 900 1000 300 400 500 600 700 Thousands of hectolitres of beer sold Source: Casewriter analysis. Case 10 Deutsche Brauerei 155 4.0% EXHIBIT 4 | Ratio Analyses of Historical and Projected Financial Statements (fiscal year ended December 31) 1997 1998 1999 2000 2001 2002 (Actual) (Actual) (Actual) (Actual) (Projd) (Projd) Profitability 1 Operating profit margin (%) 7.3% 7.6% 6.0% 6.6% 7.0% 7.0% 2 Average tax rate (%) 33.8% 34.5% 39.5% 39.0% 35.0% 35.0% 3 Return on sales (%) 3.6% 4.0% 2.8% 3.2% 3.5% 3.6% 4 Return of equity (%) 8.4% 9.8% 8.4% 10.3% 12.7% 14.2% 5 Return on net assets (%) 6.5% 7.4% 6.9% 8.4% 9.3% 9.7% 6 Return on assets (9) 3.9% 4.7% 3.9% 4.7% 5.4% 5.8% Leverage 7 Debt'Equity ratio (%) 72.3% 65.6% 67.3% 66.0% 77.0% 82.7% 8 Debt Total capital (%) 41.9% 39.6% 40.2% 39.8% 43.5% 45.3% 9 EBIT/Interest (x) 3.8 4.8 4.7 4.7 5.0 5.1 Asset Utilization 10 Sales/Assets 1.10 1.20 1.38 1.48 1.54 1.60 11 Sales growth rate (%) 7.9% 22.2% 12.6% 14.8% 12.6% 12 Assets growth rate (%) 6.0% 0.9% 6.0% 4.5% 10.9% 8.4% 13 Receivables growth rate (%) 4.0% 9.1% 49.5% 21.0% 23.5% 17.8% 14 Receivables growth rate: Germany 4.0% 3.0% 1.1% 4.1% 1.9% 3.0% 15 Receivables growth rate: Ukraine 0.0% nmt 863.5% 50.8% 49.8% 30.0% 16 Days in receivables 40.8 41.3 50.5 54.3 58.4 61.1 17 Days in receivables: Germany 40.8 41.6 41.0 41.4 41.0 41.0 18 Days in receivables: Ukraine nmt 36.3 85.0 87.1 90.0 90.0 19 Payables to sales 5.8% 5.6% 5.0% 5.2% 5.0% 5.0% 20 Inventories to sales 9.9% 9.6% 9.6% 14.0% 14.0% 14.0% Liquidity 21 Current ratio 1.32 1.03 1.15 1.34 1.27 1.25 22 Quick ratio 0.88 0.73 0.84 0.88 0.84 0.84 Notes: These financial ratios show the performance of the firm in four important areas: Profitability is measured both in terms of profit or expense margins (lines 1-3) and as investment returns nes 4-6). Investors will focus on the latter measures of profitability Leverage ratios measure the use of short-term and long-term debt financing by the firm. In general, higher usage of debt increases the risk of the firm. Higher ratios of debt to equity and to capital (lines 7 and 8) suggest higher inancial risk. The ratio of EBIT to interest expense measures the ability of the firm to "cover" its interest payments; lower levels of this ratio suggest higher risk (line 9). Asset-utilization ratios measure the efficiency of asset use. For instance, the sales-to-assets ratio (line 10) shows how many euros of sales are generated per euro of assets; a higher figure suggests more efficiency, while a lower gure suggests less efficiency. Over the long term, differences in the growth rates of sales (line 11) and assets line 12) can lead to production problems of over or undercapacity. Days in receivables (lines 16-18) shows how many days it takes to collect the average credit sale; the longer it takes the greater the investment in receivables. Liquidity ratios measure the resources available to meet short-term financial commitments. The current ratio line 21) is the ratio of all current assets to all current liabilities. The quick ratio (line 22) is the ratio of only cash and receivables (i.e, those assets that can be liquidated quickly) to all current liabilities. mmf = not a meaningful figure. 154 Part Two Financial Analysis and Forecasting EXHIBIT 3 Sources-and-Uses-of-Funds Statements (fiscal year ending December 31; all figures in thousands) 1997 1998 1999 2000 2001 2002 (Actual) (Actual) (Actual) (Actual) (Prog'd) (Projd) Sources of Funds 1 Net income 2,646 2.311 2,915 3,724 4,311 2 Increases in allowance for doubtful accts. 7 38 24 201 60 3 Depreciation 4,314 5,844 6,068 6,766 7,448 4 Increases in short-term debt 7,249 1.768 1,085 4,773 3510 5 Increases in accounts payable 177 348 690 492 664 6 Increases in other current liabilities (36) 1,635 1,131 1,498 1,462 7 Total Sources of Cash 14,357 11,943 11,913 17,454 17,456 Uses of Funds 8 Dividend payments 1,988 1,734 2,186 2,793 3,234 9 Increases in cash balance 2,817 1,630 1,234 1,634 1,595 10 Increases in accts receivable (Germany) 209 79 296 144 230 11 Increases in accts receivable (Ukraine) 424 3,665 2,078 3,074 2,772 12 Increases in inventories 267 1,417 5,072 1,906 1,861 13 Increases in other assets 87 227 104 (20) 0 14 Reductions in long-term debt 8,563 943 943 943 943 15 Capital expenditures 0 2,247 0 6,980 6,822 16 Total Uses of Cash 14,357 11,943 11,913 17,454 17,456 Source: Casewriter analysis. Case 10 Deutsche Brauerei 153 EXHIBIT 2 Historical | Exchange Rates: Ukrainian Hryvna to Deutsche Mark/Euro Deutsche Marks per 1 Ukrainian Hryvna 1.20 1.00 0.80 Russian crisis 0.60 woman 0.40 0.20 0.00 4/3/1997 7/3/1997 10/3/1997 7/3/2000 10/3/2000 1/3/2000 4/3/2000 7/3/1999 10/3/1999 1/3/1999 4/3/1999 4/3/1998 7/3/1998 10/3/1998 8661/8/ Euros per 1 Ukrainian Hryvna 0.30 0.25 mmmune 0.20 0.15 0.10 0.05 2/15/2000 4/15/2000 12/15/1999 10/15/1999 8/15/1999 6/15/1999 2/15/1999 4/15/1999 12/15/1998 0.00 6/15/2000 8/15/2000 10/15/2000 12/15/2000 Source: http://www.canda a.com/convertixhistory 152 Part Two Financial Analysis and Forecasting EXHIBIT 1 Historical and Projected Income Statements and Balance Sheets (fiscal year ended December 31, all figures in thousands) 1997 1998 1999 2000 2001 2002 (Actual) (Actual) (Actual) (Actual) (Projd) (Proj'd) Income Statements 1 Sales: Germany 62,032 62,653 64,219 66,216 68,203 70,249 2 Sales: Ukraine 4,262 17,559 25,847 37,479 48,722 3 Net sales 62,032 66,915 81,779 92,064 105,682 118,971 operating expenses: 4 Production costs and expenses 32,258 35,366 44,271 49.827 61,393 71,609 5 Admin and selling expenses 12,481 13,014 16,274 18,505 18,500 18,500 6 Depreciation 3,609 4,314 5,844 6,068 6.766 7,448 7 Excise duties 9,143 9,108 10,486 11,557 11,625 13,087 8 Total operating expenses (57,491) (61,802) (76,874) (85,957) (98,284) (110,644) 9 Operating profit 4,541 5,113 4,904 6,106 7,398 8,327 10 Allowance for doubtful accounts (5) (7) (38) (24) (201) (60) 11 Interest expense (1,185) (1,064) (1,046) (1.304) (1,468) (1,634) 12 Earnings before taxes 3,351 4,042 3,821 4.779 5,729 6,633 13 Income taxes (1,132) (1,396) (1,510) (1.864) (2,005) (2,322) 14 Net earnings 2,219 2,646 2,311 2.915 3,724 4,311 Dividends on: 15 Dividends to all common shares 1,669 1,988 1.734 2,186 2.793 3,234 16 Retentions of earnings 550 658 577 729 931 1,078 Balance Sheets Assets 1 Cash 5,366 8,183 9,813 11.048 12,682 14,277 2 Accounts receivable Germany 6,933 7,142 7,222 7.517 7,661 7,891 Ukraine 424 4,090 6.168 9,241 12,014 Allowance for doubtful accounts (69) (76) (113) (137) (338) (398) 3 Inventories 6,133 6,401 7,817 12,889 14,795 15,656 4 Total current assets 18,363 22,075 28,829 37,485 44,042 50,439 5 Investments & other assets 3,102 3,189 3,416 3,520 3,500 3,500 6 Gross property, plant, & equipt. 58,435 58,435 60.682 60,682 67.663 74,485 7 Accumulated depreciation (23,404) (27,719) (33,562) (39,631) (46,397) (53,845) 8 Net Property, plant, & equipt. 35,031 30,716 27,120 21,052 21,266 20,639 9 Total assets 56,496 55,981 59,365 62.057 68,808 74,579 Liabilities and Stockholders' Equity 10 Bank borrowings (short term) 2,987 10,236 12,004 13,089 17,862 21,372 11 Accounts payable 3,578 3,755 4,103 4,792 5,284 5.949 12 Other current liabilities 7,397 7,361 8,996 10,127 11,625 13,087 13 Total current liabilities 13,962 21,352 25,103 28,009 34.771 40,407 14 Long term debt: Bank borrowings 16,107 7,544 6,601 5,658 4.715 3,772 15 Shareholders' equity 26,427 27,085 27,661 28,390 29,321 30,399 16 Total liabs & stockholders' equity 56,496 55,981 59,365 62,057 68,808 74,579 Source: Casewriter analysis Deutsche Brauerei 151 inventories has been to support the fragile distributor network by carrying a substantial part of the inventory on behalf of the distributor. This resulted in a sizable increase in inventory for the company in 1999 and 2000. These new marketing policies have paid off handsomely in terms of our unit growth in the new federal states. Sales in Ukraine grew 47 percent in 2000a rate of increase that I aim to sustain for the foreseeable future. Without my changes in credit and inventory policy, we would have realized only a small fraction of our current level of sales there. In 2001, I hope to establish five more distributors and place our beer in 100 more stores and restaurants, Greta inquired about the signs of global economic recession. Pinchuk seemed rel- atively unconcerned. He said, "I don't think Ukraine will be affected. Last year the economy grew 7 percent, and this year it is predicted to grow 10 percent. I expect unit sales in Ukraine to rise significantly in 2001." At the close of their meeting, Greta asked for information on Deutsche's credit customers. Pinchuk supplied several files from which Greta extracted the summary information in Exhibit 7. Conclusion After a lengthy dinner that evening, at which she met the other directors, Greta returned to the information she had gathered that day. She would need to form an opinion on the three matters coming before the board the next day (the financial plan, the dividend declaration, and the compensation plan for Pinchuk). She also wanted to study the company's reliance on debt financing. The other directors would be inter- ested to know why, if the company was operating so profitably above its break-even volume, it needed to borrow so aggressively. Greta also wondered about the wisdom of Deutsche's aggressive penetration of Ukraine: did rapid sales growth necessarily pay off in terms of more profits or dividends? All this would take more study. She yawned and then poured herself a cup of coffee before returning to scrutinize the numbers. 150 Part Two Financial Analysis and Forecasting rely on the dividend to help make ends meet. We have traditionally aimed for a 75 percent dividend payout from earnings each year, to serve our older relatives. Lukas Schweitzer had been quite talkative during the meal, allowing Greta little opportunity to ask questions or offer her own opinions. She was disquieted by some of the statements she heard, however, and resolved to study the historical and fore- cast financials in detail. Then, quite abruptly, Uncle Lukas announced that lunch was done and he would take her to meet Oleg Pinchuk. Meeting with Oleg Pinchuk After the introductory pleasantries, Greta asked Pinchuk to describe his marketing strategy and achievements in Ukraine. He said: Our beer almost sells itself, discount pricing and heavy advertising are unwarranted. The challenge is getting people to try it and getting it into a distribution pipeline, so that when the consumer wants to buy more, he or she can do so. But in 1998, the beer-distribution pipeline in Ukraine was nonexistent. I had to go there and set up distributorships from nothing, there were willing entrepreneurs, but they had no capital. I provided the best financing I knew how, in the form of trade-credit concessions. First, I extended credit to distributors in Ukraine who could not bear the terms we customarily gave our distributors in western Germany. I relaxed the terms for those new distributors from 2 percent 10, net 40, to 2 percent 10, net 80. Even on these terms, our distributors are asking for more time to pay: I plan to relax the payment deadline to 90 days. I am confident that we will collect on all of those receivables, my forecast assumes that bad debts as a percentage of accounts receivable will amount to only 2 percent. These distributors are real entrepreneurs. They started with nothing but their brains. They have great ambitions and learn quickly. Some of them have gotten past due on their payments to us, but I suspect that they will catch up in due course. Virtually all the retailers and restaurateurs we supply are expanding and enhancing their shops, buying modern equipment, and restocking their own inventories--all without the support of big banks like yours in Frankfurt! Most of those retailers can't get bank credit, their "bootstrap" financing is ingenious and admirable. A little delay in payment is understandable. Where we see great opportunity in these distributors, the banks see no collateral, low profits, negative cash flow and high risk. I know these distributors better than the banks know them. I think we'll make a profit on our investment there. My analysis (see Exhibit 6) suggests that we are earning a very high return on our investment in receivables in Ukraine. We borrow at 6.5 percent from our bank in the West, and use those funds to finance receivables in Ukraine that give us a return of about 130 percent! 1 should add that the other parts of my marketing strategy involve field warehousing. to permit rapid response to market demand, and quite a lot of missionary activity, to see that our beer receives the proper placement in stores and restaurants. My policy on field Bez percent 10, net 40" means that Deutsche's customer can take u 2 percent discount if payment is made within 10 days of the invoice and that, otherwise, the full payment is due within 40 days. Case 10 Deutsche Brauerei 149 Over the long history of this company, the Schweitzers have had to be brewers, not marketers or finance people. As long as we made an excellent product, we always sold our output at the price we asked. Then, in the 1990s. I realized that we needed more than just production know-how. The collapse of the Berlin Wall, and then the dissolution of the Soviet Union, convinced me that tremendous opportunities existed in Eastern Europe, I hired Oleg Pinchuk to lead this initiative. I'm quite pleased with what Oleg has been able to accomplish. He has organized five distributorships, taken us from 0 to 211 customer accounts, and set up warehousing arrangements--in 30 months, and on a small budget! He really produces results. I am afraid I will have to pay him a lot more money next year, if I am to keep him. As it is, I paid him 82,344 in 2000, consisting of a base salary of 40,000 and an incentive payment of 41,440, which is calculated as 0.5 percent of the annual sales increase in Ukraine. As you know from my letter to the board of directors. I am proposing increases in both his base salary (to 48,500) and incentive payment (60 0.6 percent of the annual sales increase). Oleg was very helpful in pulling together the financial plan for 2001 (sce Exhibit 1). It shows handsomely rising sales and profits! Also, he prepared various analytical pre- sentations, including a sources-and-uses-of-funds statement (Exhibit 3) and a detailed ratio analysis (Exhibit 4). One very helpful analysis was the break-even chart Oleg prepared (Exhibit 5). It shows that, as we increase our volume above the break-even volume, our profits risc disproportionately faster. If we keep on this growth course, we'll exhaust our existing unused productive capacity by late 2001. The budget for 2001 calls for investment of 7 million in new plant and cquipment. For 2002, Oleg has proposed that we invest 6.8 million in a state- of-the-art warehouse and distribution center in Ukraine. He argues that we won't be able to sustain our growth in Ukraine without those major investments. I haven't even begun thinking about how we will finance all this growth. In recent years, we have depended more on short-term bank loans than we used to. I don't know whether we should continue to rely on them to the extent that we have. Right now, we can borrow from our long- standing Hausbank at a 6.5 percent rate of interest. Our banker asked me to meet with him next week lo discuss our expansion plans, I'm guessing that he can't wait to get more of our business! With the improved profits, I am proposing an increase in dividends for this quarter to a total of 698.000, one-fourth of the dividends projected to be paid in 2001. This should keep the Schweitzer family happy. As you know, half of our family stockholders are retirees and This chart shows the relationship between revenues, costs, and volume of oupu. For instance, revenues ac calculated as the volume of hectoliters of beer sold times the unit price of 78.5 per hectoliter. Fixed costs (24.6 million) remain constant as unit output varies, and are the sum of administration and selling expense plus depreciation. Variable costs are the sum of production costs, excise duties, and allowance for doubtful accounts, or 52.3 per hectoliter. At any given level of output, total costs are the sum of variable and fixed costs, Profils or losses are illustrated as the difference between the revenue and total cost lines, but note carefully that profit" here is implicitly defined as earnings before interest and taxes (EBIT). This analysis identifies the break-even volume, where revenues just equal total costs. Deutsche Brauerei's break-even volume was 938,799 hectoliters. Pln January 2001, the yield on short-term enro government debt was 4.58 percent. 148 Part Two Financial Analysis and Forecasting a the company sold 1.173 million hectoliters. This equipment was acquired in 1994, fol- lowing a fire that destroyed the old equipment. Because of its efficiency improvements and slightly larger size, the new equip- ment increased the potential output of the brewery. This additional capacity remained unused, however, until late 1998. In that year, Deutsche Brauerei expanded into Ukraine. Following the dissolution of the U.S.S.R., Lukas Schweitzer had envisioned a significant new market for high-quality beer in Eastern Europe, particularly in the former Soviet states, and resolved to penetrate that market. Ukraine was particularly attractive given its relatively larger population of 52 million and its strategic location within Central and Eastern Europe. In 1995 and 1996, the Ukrainian government embarked on a wave of privatiza- tions and market reforms. The Ukrainian government's posture convinced the Schweitzer family that it was a favorable time to enter the Ukrainian market. After analyzing various entry options, the Schweitzers decided to enter Ukraine through a network of independent distributors. Launched in 1998, Deutsche's beer was an overnight success. Accordingly, Lukas Schweitzer hired Oleg Pinchuk away from a major Ukrainian beer producer to market Deutsche's beer even more aggressively. The beer won popularity for its full-bodied, malty taste. A factor extrinsic to the product-the fragmented nature of the Ukrainian beer industryalso provided easy entry opportunities for Deutsche Brauerei. When the Russian debt crisis hit in 1998, the Ukrainian hryvna depreciated by 125 percent within three months (see Exhibit 2). The depreciation of the hryvna resulted in lower revenue, profit, and asset values when translated into deutsche marks (Germany's currency in 1998). Because of the popularity of Deutsche's beer, how- ever, the increase in Deutsche Brauerei's volume sales more than offset the negative currency effects. By early 2001, Ukrainian consumers accounted for 28 percent of Deutsche's sales. Further, Ukraine had accounted for most of the unit growth in Deutsche's sales over the past three years. In Germany, Deutsche Brauerei served its markets through a network of inde- pendent distributors. Those distributors purchased Deutsche's beer, stored it tem- porarily in their own refrigerated warehouses, and ultimately sold it to their customers at the retail end of the distribution chain (e.g., stores, restaurants, and hotels). Oleg Pinchuk had adopted a different distribution strategy with regard to Ukraine, Lunch with Uncle Lukas After driving down from Frankfurt, Greta's visit began with a luncheon meeting with Lukas Schweitzer. Now 57, Lukas had worked at the brewery for his entire career. His experience had been largely on the production side of the brewery, where he had risen to the position of brewmaster before assuming general management of the com- pany upon the retirement of his father. He said: TI- For 2001 and 2002, the hryvna was not expected to depreciate materially against the curo. As Exhibit 2 shows, the hryvna had held steady since the Russian default. In January 2001. (Ukrainian hryvna) UAGI was equivalent to 0.20. Deutsche Brauerei In early January 2001, Greta Schweitzer arrived at Deutsche Brauerei' to participate in her first meeting of the board of directors. She had recently joined the board at the behest of her uncle, the managing director of the company. Lukas Schweitzer had told her that the board could use her financial expertise in addressing some questions that would come up in the near future, but he would not be specific as to the nature of those questions. The company was owned entirely by 16 uncles, aunts, and cousins from the Schweitzer family. Greta had received an MBA degree from a well-known business school and had worked for the past six years as a commercial-loan officer for a leading bank in Frankfurt, Germany. With the permission of the bank, she agreed to join the Deutsche Brauerei board. The agenda for the January meeting of the directors consisted of three items of business: (1) approval of the 2001 financial budget, (2) declaration of the quarterly dividend, and (3) adoption of a compensation scheme for Oleg Pinchuk, the com- pany's sales-and-marketing manager. Because she knew little about the company. Greta decided to visit it for a day before the first board meeting. The Company Deutsche Brauerei produced two varieties of beer, dark and light, for which it had won quality awards consistently over the years. Its sales and profits in 2000 were (euros) 92.1 million and 2.9 million, respectively. (See Exhibit 1 for historical and projected financial statements.) Founded in 1737, the Deutsche Brauerei had been in the Schweitzer family for 12 generations. An etching of Gustav Schweitzer, the founder, graced the label of each bottle of beer. The company was located in a village just outside Munich, Germany. Its modern equipment was capable of producing 1.2 million hectoliters of beer a year. In 2000, 'In English Deutsche Brauerei" (Dol-chu BROI-reye) meatis "German brewery." In January 2001, the euro could be exchanged for about US$0.94. This case was written by Robert E. Bruner. It was written as a basis for class discussion rather than to illustrate effective or ineffective handling of an administrative situation. Deutsche Brauerei is a fictional company reflecting the issues facing actual organizations. Copyright 2001 by the University of Virginia Darden School Foundation, Charlottesville, VA. All rights reserved. To order copies, send an email to sales@dardenpublishing.com. No part of this publication may be reproduced, stored in a retrieval system, used in a spreadsheet, or transmitted in any form or by any means-electronic, mechanical, photocopying, recording, or otherwise-without the permission of the Darden Scheel Foundation 147 158 Part Two Financial Analysis and Forecasting EXHIBIT 7 Selected Information on Deutsche's Distributors in Ukraine Composite Ratios, German Beer- Distribution Industry Kharkiv Dnipropetrovsk Odessa Donetsk Kiev 2,530,935 1.8% 1.7% 2,024,748 2.2% 1.9% 2,812,150 843,645 3,475,255 3.0% 1.1% 3.5% 2.3% 0.7% 3.1% n.a. 3.7% 3.5% 12.9% 15.1% 33.1% 100.0% 13.5% 19.0% 29.1% 100.0% 16.5% 30.0% 25.0% 100.0% 19.5% 25.0% 21.0% 100.0% 13.0% 22.0% 28.0% 100.0% 12.0% 31.0% 24.0% 100.0% Deutsche Distributors by City: Income Data Net sales, 2000 Operating profit/sales Pretax profit/sales Assets (as % of total) Trade receivables Inventory Fixed assets Total Liabilities Short-term bank borrowings Trade payables Total current liabs. Long-term debt Net worth Total Ratios Current ratio Days' sales outstanding Sales/assets Pretax profit/assets Debt/equity 0.1% 29.2% 35.0% 2.5% 32.5% 100.0% 2.1% 32.2% 41.0% 0.0% 59.0% 100.0% 1.5% 28.7% 33.2% 3.0% 63.8% 100.0% 2.5% 37.5% 43.2% 0.0% 56.2% 100.0% 4.0% 19.0% 27.0% 5.0% 68.0% 100.0% 15.0% 16.3% 39.4% 16.0% 44.6% 100.0% 1.1 27.7 2.0 2.99 8.0% 1.2 25.9 1.9 3.6% 3.6% 1.1 27.4 2.2. 5.1% 7.1% 0.9 39.5 1.8 1.3% 4.4% 1.6 19.8 2.4 7.4% 13.2% 1.4 19.4 2.3 8.0% 69.5% Source: Casewriter analysis. n.a. - not applicable Case 10 Deutsche Brauerei 157 EXHIBIT 6 | Oleg Pinchuk's Analysis of the Return on Investment from Investment in Accounts Receivable in Ukraine To: Lukas Schweitzer From: Oleg Pinchuk The following table illustrates the high profitability we have achieved on our investment in receivables in Ukraine. We can look forward to a return of about 120-130 percent on our receivables from the East. The return on investment is calculated as follows: Return on investment Marginal after-tax profit contribution Required marginal investment The numerator is simply the profits we earn on new sales each year in Ukraine. It excludes the fixed costs because we assume those costs have been covered: we want to focus only on the marginal events. Also, it assumes that, without the extension of credit, no sales growth would occur in Ukraine. The denominator is Deutsche's investment in the receivables. This is not the face amount of the receivablos; it is only the cash outlay for the product underlying the receivable. Accordingly, for 2001, the calculation is: Investment in accounts receivable (AR) = (Variable costs - Sales) Change in AR = (52.31 78.49) 3,073,536 - 2,048,512 Assumptions Revenue per HL () 78.49 Variable Costs per HL () 52.31 Contribution Percentage 33% Tax Rate 35% Sales in Ukraine (, thousands) Change in sales (, thousands) Variable costs on the marginal sales Contribution on the marginal sales Taxes on the marginal contribution Marginal After-tax Profits ( thousands) Variable costs/Sales Change in accounts receivable, Ukraine ( thousands) Investment in Accts. Receivable ( thousands) Return on Marginal Investment in Receivables 1997 1998 1999 2000 2001 2002 (Actual) (Actual) (Actual) (Actual) (Projd) (Projd) 4,262 17.559 25.847 37,479 48,722 4,262 13.297 8.288 11,631 11,244 (2.841) (8.863) (5.524) (7.752) (7.494) 1,421 4,435 2.764 3,879 3,750 (497) (1.552) (967) (1,358) (1,312) 924 2.883 1.797 2,521 2,437 67% 67% 67% 67% 67% 424 3,665 2,078 3,074 2.772 283 2.443 1,385 2,049 1,848 0% 327% 118% 130% 123% 132% 156 Part Two Financial Analysis and Forecasting EXHIBIT 5 Break-Even Chart Break-even Chart for Deutsche Brauerei 90 80 70 60 Total cost. 50 Millions of euros Variable cost 40 Revenues 30 Fixed cost 20 10 0 100 200 800 900 1000 300 400 500 600 700 Thousands of hectolitres of beer sold Source: Casewriter analysis. Case 10 Deutsche Brauerei 155 4.0% EXHIBIT 4 | Ratio Analyses of Historical and Projected Financial Statements (fiscal year ended December 31) 1997 1998 1999 2000 2001 2002 (Actual) (Actual) (Actual) (Actual) (Projd) (Projd) Profitability 1 Operating profit margin (%) 7.3% 7.6% 6.0% 6.6% 7.0% 7.0% 2 Average tax rate (%) 33.8% 34.5% 39.5% 39.0% 35.0% 35.0% 3 Return on sales (%) 3.6% 4.0% 2.8% 3.2% 3.5% 3.6% 4 Return of equity (%) 8.4% 9.8% 8.4% 10.3% 12.7% 14.2% 5 Return on net assets (%) 6.5% 7.4% 6.9% 8.4% 9.3% 9.7% 6 Return on assets (9) 3.9% 4.7% 3.9% 4.7% 5.4% 5.8% Leverage 7 Debt'Equity ratio (%) 72.3% 65.6% 67.3% 66.0% 77.0% 82.7% 8 Debt Total capital (%) 41.9% 39.6% 40.2% 39.8% 43.5% 45.3% 9 EBIT/Interest (x) 3.8 4.8 4.7 4.7 5.0 5.1 Asset Utilization 10 Sales/Assets 1.10 1.20 1.38 1.48 1.54 1.60 11 Sales growth rate (%) 7.9% 22.2% 12.6% 14.8% 12.6% 12 Assets growth rate (%) 6.0% 0.9% 6.0% 4.5% 10.9% 8.4% 13 Receivables growth rate (%) 4.0% 9.1% 49.5% 21.0% 23.5% 17.8% 14 Receivables growth rate: Germany 4.0% 3.0% 1.1% 4.1% 1.9% 3.0% 15 Receivables growth rate: Ukraine 0.0% nmt 863.5% 50.8% 49.8% 30.0% 16 Days in receivables 40.8 41.3 50.5 54.3 58.4 61.1 17 Days in receivables: Germany 40.8 41.6 41.0 41.4 41.0 41.0 18 Days in receivables: Ukraine nmt 36.3 85.0 87.1 90.0 90.0 19 Payables to sales 5.8% 5.6% 5.0% 5.2% 5.0% 5.0% 20 Inventories to sales 9.9% 9.6% 9.6% 14.0% 14.0% 14.0% Liquidity 21 Current ratio 1.32 1.03 1.15 1.34 1.27 1.25 22 Quick ratio 0.88 0.73 0.84 0.88 0.84 0.84 Notes: These financial ratios show the performance of the firm in four important areas: Profitability is measured both in terms of profit or expense margins (lines 1-3) and as investment returns nes 4-6). Investors will focus on the latter measures of profitability Leverage ratios measure the use of short-term and long-term debt financing by the firm. In general, higher usage of debt increases the risk of the firm. Higher ratios of debt to equity and to capital (lines 7 and 8) suggest higher inancial risk. The ratio of EBIT to interest expense measures the ability of the firm to "cover" its interest payments; lower levels of this ratio suggest higher risk (line 9). Asset-utilization ratios measure the efficiency of asset use. For instance, the sales-to-assets ratio (line 10) shows how many euros of sales are generated per euro of assets; a higher figure suggests more efficiency, while a lower gure suggests less efficiency. Over the long term, differences in the growth rates of sales (line 11) and assets line 12) can lead to production problems of over or undercapacity. Days in receivables (lines 16-18) shows how many days it takes to collect the average credit sale; the longer it takes the greater the investment in receivables. Liquidity ratios measure the resources available to meet short-term financial commitments. The current ratio line 21) is the ratio of all current assets to all current liabilities. The quick ratio (line 22) is the ratio of only cash and receivables (i.e, those assets that can be liquidated quickly) to all current liabilities. mmf = not a meaningful figure. 154 Part Two Financial Analysis and Forecasting EXHIBIT 3 Sources-and-Uses-of-Funds Statements (fiscal year ending December 31; all figures in thousands) 1997 1998 1999 2000 2001 2002 (Actual) (Actual) (Actual) (Actual) (Prog'd) (Projd) Sources of Funds 1 Net income 2,646 2.311 2,915 3,724 4,311 2 Increases in allowance for doubtful accts. 7 38 24 201 60 3 Depreciation 4,314 5,844 6,068 6,766 7,448 4 Increases in short-term debt 7,249 1.768 1,085 4,773 3510 5 Increases in accounts payable 177 348 690 492 664 6 Increases in other current liabilities (36) 1,635 1,131 1,498 1,462 7 Total Sources of Cash 14,357 11,943 11,913 17,454 17,456 Uses of Funds 8 Dividend payments 1,988 1,734 2,186 2,793 3,234 9 Increases in cash balance 2,817 1,630 1,234 1,634 1,595 10 Increases in accts receivable (Germany) 209 79 296 144 230 11 Increases in accts receivable (Ukraine) 424 3,665 2,078 3,074 2,772 12 Increases in inventories 267 1,417 5,072 1,906 1,861 13 Increases in other assets 87 227 104 (20) 0 14 Reductions in long-term debt 8,563 943 943 943 943 15 Capital expenditures 0 2,247 0 6,980 6,822 16 Total Uses of Cash 14,357 11,943 11,913 17,454 17,456 Source: Casewriter analysis. Case 10 Deutsche Brauerei 153 EXHIBIT 2 Historical | Exchange Rates: Ukrainian Hryvna to Deutsche Mark/Euro Deutsche Marks per 1 Ukrainian Hryvna 1.20 1.00 0.80 Russian crisis 0.60 woman 0.40 0.20 0.00 4/3/1997 7/3/1997 10/3/1997 7/3/2000 10/3/2000 1/3/2000 4/3/2000 7/3/1999 10/3/1999 1/3/1999 4/3/1999 4/3/1998 7/3/1998 10/3/1998 8661/8/ Euros per 1 Ukrainian Hryvna 0.30 0.25 mmmune 0.20 0.15 0.10 0.05 2/15/2000 4/15/2000 12/15/1999 10/15/1999 8/15/1999 6/15/1999 2/15/1999 4/15/1999 12/15/1998 0.00 6/15/2000 8/15/2000 10/15/2000 12/15/2000 Source: http://www.canda a.com/convertixhistory 152 Part Two Financial Analysis and Forecasting EXHIBIT 1 Historical and Projected Income Statements and Balance Sheets (fiscal year ended December 31, all figures in thousands) 1997 1998 1999 2000 2001 2002 (Actual) (Actual) (Actual) (Actual) (Projd) (Proj'd) Income Statements 1 Sales: Germany 62,032 62,653 64,219 66,216 68,203 70,249 2 Sales: Ukraine 4,262 17,559 25,847 37,479 48,722 3 Net sales 62,032 66,915 81,779 92,064 105,682 118,971 operating expenses: 4 Production costs and expenses 32,258 35,366 44,271 49.827 61,393 71,609 5 Admin and selling expenses 12,481 13,014 16,274 18,505 18,500 18,500 6 Depreciation 3,609 4,314 5,844 6,068 6.766 7,448 7 Excise duties 9,143 9,108 10,486 11,557 11,625 13,087 8 Total operating expenses (57,491) (61,802) (76,874) (85,957) (98,284) (110,644) 9 Operating profit 4,541 5,113 4,904 6,106 7,398 8,327 10 Allowance for doubtful accounts (5) (7) (38) (24) (201) (60) 11 Interest expense (1,185) (1,064) (1,046) (1.304) (1,468) (1,634) 12 Earnings before taxes 3,351 4,042 3,821 4.779 5,729 6,633 13 Income taxes (1,132) (1,396) (1,510) (1.864) (2,005) (2,322) 14 Net earnings 2,219 2,646 2,311 2.915 3,724 4,311 Dividends on: 15 Dividends to all common shares 1,669 1,988 1.734 2,186 2.793 3,234 16 Retentions of earnings 550 658 577 729 931 1,078 Balance Sheets Assets 1 Cash 5,366 8,183 9,813 11.048 12,682 14,277 2 Accounts receivable Germany 6,933 7,142 7,222 7.517 7,661 7,891 Ukraine 424 4,090 6.168 9,241 12,014 Allowance for doubtful accounts (69) (76) (113) (137) (338) (398) 3 Inventories 6,133 6,401 7,817 12,889 14,795 15,656 4 Total current assets 18,363 22,075 28,829 37,485 44,042 50,439 5 Investments & other assets 3,102 3,189 3,416 3,520 3,500 3,500 6 Gross property, plant, & equipt. 58,435 58,435 60.682 60,682 67.663 74,485 7 Accumulated depreciation (23,404) (27,719) (33,562) (39,631) (46,397) (53,845) 8 Net Property, plant, & equipt. 35,031 30,716 27,120 21,052 21,266 20,639 9 Total assets 56,496 55,981 59,365 62.057 68,808 74,579 Liabilities and Stockholders' Equity 10 Bank borrowings (short term) 2,987 10,236 12,004 13,089 17,862 21,372 11 Accounts payable 3,578 3,755 4,103 4,792 5,284 5.949 12 Other current liabilities 7,397 7,361 8,996 10,127 11,625 13,087 13 Total current liabilities 13,962 21,352 25,103 28,009 34.771 40,407 14 Long term debt: Bank borrowings 16,107 7,544 6,601 5,658 4.715 3,772 15 Shareholders' equity 26,427 27,085 27,661 28,390 29,321 30,399 16 Total liabs & stockholders' equity 56,496 55,981 59,365 62,057 68,808 74,579 Source: Casewriter analysis Deutsche Brauerei 151 inventories has been to support the fragile distributor network by carrying a substantial part of the inventory on behalf of the distributor. This resulted in a sizable increase in inventory for the company in 1999 and 2000. These new marketing policies have paid off handsomely in terms of our unit growth in the new federal states. Sales in Ukraine grew 47 percent in 2000a rate of increase that I aim to sustain for the foreseeable future. Without my changes in credit and inventory policy, we would have realized only a small fraction of our current level of sales there. In 2001, I hope to establish five more distributors and place our beer in 100 more stores and restaurants, Greta inquired about the signs of global economic recession. Pinchuk seemed rel- atively unconcerned. He said, "I don't think Ukraine will be affected. Last year the economy grew 7 percent, and this year it is predicted to grow 10 percent. I expect unit sales in Ukraine to rise significantly in 2001." At the close of their meeting, Greta asked for information on Deutsche's credit customers. Pinchuk supplied several files from which Greta extracted the summary information in Exhibit 7. Conclusion After a lengthy dinner that evening, at which she met the other directors, Greta returned to the information she had gathered that day. She would need to form an opinion on the three matters coming before the board the next day (the financial plan, the dividend declaration, and the compensation plan for Pinchuk). She also wanted to study the company's reliance on debt financing. The other directors would be inter- ested to know why, if the company was operating so profitably above its break-even volume, it needed to borrow so aggressively. Greta also wondered about the wisdom of Deutsche's aggressive penetration of Ukraine: did rapid sales growth necessarily pay off in terms of more profits or dividends? All this would take more study. She yawned and then poured herself a cup of coffee before returning to scrutinize the numbers. 150 Part Two Financial Analysis and Forecasting rely on the dividend to help make ends meet. We have traditionally aimed for a 75 percent dividend payout from earnings each year, to serve our older relatives. Lukas Schweitzer had been quite talkative during the meal, allowing Greta little opportunity to ask questions or offer her own opinions. She was disquieted by some of the statements she heard, however, and resolved to study the historical and fore- cast financials in detail. Then, quite abruptly, Uncle Lukas announced that lunch was done and he would take her to meet Oleg Pinchuk. Meeting with Oleg Pinchuk After the introductory pleasantries, Greta asked Pinchuk to describe his marketing strategy and achievements in Ukraine. He said: Our beer almost sells itself, discount pricing and heavy advertising are unwarranted. The challenge is getting people to try it and getting it into a distribution pipeline, so that when the consumer wants to buy more, he or she can do so. But in 1998, the beer-distribution pipeline in Ukraine was nonexistent. I had to go there and set up distributorships from nothing, there were willing entrepreneurs, but they had no capital. I provided the best financing I knew how, in the form of trade-credit concessions. First, I extended credit to distributors in Ukraine who could not bear the terms we customarily gave our distributors in western Germany. I relaxed the terms for those new distributors from 2 percent 10, net 40, to 2 percent 10, net 80. Even on these terms, our distributors are asking for more time to pay: I plan to relax the payment deadline to 90 days. I am confident that we will collect on all of those receivables, my forecast assumes that bad debts as a percentage of accounts receivable will amount to only 2 percent. These distributors are real entrepreneurs. They started with nothing but their brains. They have great ambitions and learn quickly. Some of them have gotten past due on their payments to us, but I suspect that they will catch up in due course. Virtually all the retailers and restaurateurs we supply are expanding and enhancing their shops, buying modern equipment, and restocking their own inventories--all without the support of big banks like yours in Frankfurt! Most of those retailers can't get bank credit, their "bootstrap" financing is ingenious and admirable. A little delay in payment is understandable. Where we see great opportunity in these distributors, the banks see no collateral, low profits, negative cash flow and high risk. I know these distributors better than the banks know them. I think we'll make a profit on our investment there. My analysis (see Exhibit 6) suggests that we are earning a very high return on our investment in receivables in Ukraine. We borrow at 6.5 percent from our bank in the West, and use those funds to finance receivables in Ukraine that give us a return of about 130 percent! 1 should add that the other parts of my marketing strategy involve field warehousing. to permit rapid response to market demand, and quite a lot of missionary activity, to see that our beer receives the proper placement in stores and restaurants. My policy on field Bez percent 10, net 40" means that Deutsche's customer can take u 2 percent discount if payment is made within 10 days of the invoice and that, otherwise, the full payment is due within 40 days. Case 10 Deutsche Brauerei 149 Over the long history of this company, the Schweitzers have had to be brewers, not marketers or finance people. As long as we made an excellent product, we always sold our output at the price we asked. Then, in the 1990s. I realized that we needed more than just production know-how. The collapse of the Berlin Wall, and then the dissolution of the Soviet Union, convinced me that tremendous opportunities existed in Eastern Europe, I hired Oleg Pinchuk to lead this initiative. I'm quite pleased with what Oleg has been able to accomplish. He has organized five distributorships, taken us from 0 to 211 customer accounts, and set up warehousing arrangements--in 30 months, and on a small budget! He really produces results. I am afraid I will have to pay him a lot more money next year, if I am to keep him. As it is, I paid him 82,344 in 2000, consisting of a base salary of 40,000 and an incentive payment of 41,440, which is calculated as 0.5 percent of the annual sales increase in Ukraine. As you know from my letter to the board of directors. I am proposing increases in both his base salary (to 48,500) and incentive payment (60 0.6 percent of the annual sales increase). Oleg was very helpful in pulling together the financial plan for 2001 (sce Exhibit 1). It shows handsomely rising sales and profits! Also, he prepared various analytical pre- sentations, including a sources-and-uses-of-funds statement (Exhibit 3) and a detailed ratio analysis (Exhibit 4). One very helpful analysis was the break-even chart Oleg prepared (Exhibit 5). It shows that, as we increase our volume above the break-even volume, our profits risc disproportionately faster. If we keep on this growth course, we'll exhaust our existing unused productive capacity by late 2001. The budget for 2001 calls for investment of 7 million in new plant and cquipment. For 2002, Oleg has proposed that we invest 6.8 million in a state- of-the-art warehouse and distribution center in Ukraine. He argues that we won't be able to sustain our growth in Ukraine without those major investments. I haven't even begun thinking about how we will finance all this growth. In recent years, we have depended more on short-term bank loans than we used to. I don't know whether we should continue to rely on them to the extent that we have. Right now, we can borrow from our long- standing Hausbank at a 6.5 percent rate of interest. Our banker asked me to meet with him next week lo discuss our expansion plans, I'm guessing that he can't wait to get more of our business! With the improved profits, I am proposing an increase in dividends for this quarter to a total of 698.000, one-fourth of the dividends projected to be paid in 2001. This should keep the Schweitzer family happy. As you know, half of our family stockholders are retirees and This chart shows the relationship between revenues, costs, and volume of oupu. For instance, revenues ac calculated as the volume of hectoliters of beer sold times the unit price of 78.5 per hectoliter. Fixed costs (24.6 million) remain constant as unit output varies, and are the sum of administration and selling expense plus depreciation. Variable costs are the sum of production costs, excise duties, and allowance for doubtful accounts, or 52.3 per hectoliter. At any given level of output, total costs are the sum of variable and fixed costs, Profils or losses are illustrated as the difference between the revenue and total cost lines, but note carefully that profit" here is implicitly defined as earnings before interest and taxes (EBIT). This analysis identifies the break-even volume, where revenues just equal total costs. Deutsche Brauerei's break-even volume was 938,799 hectoliters. Pln January 2001, the yield on short-term enro government debt was 4.58 percent. 148 Part Two Financial Analysis and Forecasting a the company sold 1.173 million hectoliters. This equipment was acquired in 1994, fol- lowing a fire that destroyed the old equipment. Because of its efficiency improvements and slightly larger size, the new equip- ment increased the potential output of the brewery. This additional capacity remained unused, however, until late 1998. In that year, Deutsche Brauerei expanded into Ukraine. Following the dissolution of the U.S.S.R., Lukas Schweitzer had envisioned a significant new market for high-quality beer in Eastern Europe, particularly in the former Soviet states, and resolved to penetrate that market. Ukraine was particularly attractive given its relatively larger population of 52 million and its strategic location within Central and Eastern Europe. In 1995 and 1996, the Ukrainian government embarked on a wave of privatiza- tions and market reforms. The Ukrainian government's posture convinced the Schweitzer family that it was a favorable time to enter the Ukrainian market. After analyzing various entry options, the Schweitzers decided to enter Ukraine through a network of independent distributors. Launched in 1998, Deutsche's beer was an overnight success. Accordingly, Lukas Schweitzer hired Oleg Pinchuk away from a major Ukrainian beer producer to market Deutsche's beer even more aggressively. The beer won popularity for its full-bodied, malty taste. A factor extrinsic to the product-the fragmented nature of the Ukrainian beer industryalso provided easy entry opportunities for Deutsche Brauerei. When the Russian debt crisis hit in 1998, the Ukrainian hryvna depreciated by 125 percent within three months (see Exhibit 2). The depreciation of the hryvna resulted in lower revenue, profit, and asset values when translated into deutsche marks (Germany's currency in 1998). Because of the popularity of Deutsche's beer, how- ever, the increase in Deutsche Brauerei's volume sales more than offset the negative currency effects. By early 2001, Ukrainian consumers accounted for 28 percent of Deutsche's sales. Further, Ukraine had accounted for most of the unit growth in Deutsche's sales over the past three years. In Germany, Deutsche Brauerei served its markets through a network of inde- pendent distributors. Those distributors purchased Deutsche's beer, stored it tem- porarily in their own refrigerated warehouses, and ultimately sold it to their customers at the retail end of the distribution chain (e.g., stores, restaurants, and hotels). Oleg Pinchuk had adopted a different distribution strategy with regard to Ukraine, Lunch with Uncle Lukas After driving down from Frankfurt, Greta's visit began with a luncheon meeting with Lukas Schweitzer. Now 57, Lukas had worked at the brewery for his entire career. His experience had been largely on the production side of the brewery, where he had risen to the position of brewmaster before assuming general management of the com- pany upon the retirement of his father. He said: TI- For 2001 and 2002, the hryvna was not expected to depreciate materially against the curo. As Exhibit 2 shows, the hryvna had held steady since the Russian default. In January 2001. (Ukrainian hryvna) UAGI was equivalent to 0.20. Deutsche Brauerei In early January 2001, Greta Schweitzer arrived at Deutsche Brauerei' to participate in her first meeting of the board of directors. She had recently joined the board at the behest of her uncle, the managing director of the company. Lukas Schweitzer had told her that the board could use her financial expertise in addressing some questions that would come up in the near future, but he would not be specific as to the nature of those questions. The company was owned entirely by 16 uncles, aunts, and cousins from the Schweitzer family. Greta had received an MBA degree from a well-known business school and had worked for the past six years as a commercial-loan officer for a leading bank in Frankfurt, Germany. With the permission of the bank, she agreed to join the Deutsche Brauerei board. The agenda for the January meeting of the directors consisted of three items of business: (1) approval of the 2001 financial budget, (2) declaration of the quarterly dividend, and (3) adoption of a compensation scheme for Oleg Pinchuk, the com- pany's sales-and-marketing manager. Because she knew little about the company. Greta decided to visit it for a day before the first board meeting. The Company Deutsche Brauerei produced two varieties of beer, dark and light, for which it had won quality awards consistently over the years. Its sales and profits in 2000 were (euros) 92.1 million and 2.9 million, respectively. (See Exhibit 1 for historical and projected financial statements.) Founded in 1737, the Deutsche Brauerei had been in the Schweitzer family for 12 generations. An etching of Gustav Schweitzer, the founder, graced the label of each bottle of beer. The company was located in a village just outside Munich, Germany. Its modern equipment was capable of producing 1.2 million hectoliters of beer a year. In 2000, 'In English Deutsche Brauerei" (Dol-chu BROI-reye) meatis "German brewery." In January 2001, the euro could be exchanged for about US$0.94. This case was written by Robert E. Bruner. It was written as a basis for class discussion rather than to illustrate effective or ineffective handling of an administrative situation. Deutsche Brauerei is a fictional company reflecting the issues facing actual organizations. Copyright 2001 by the University of Virginia Darden School Foundation, Charlottesville, VA. All rights reserved. To order copies, send an email to sales@dardenpublishing.com. No part of this publication may be reproduced, stored in a retrieval system, used in a spreadsheet, or transmitted in any form or by any means-electronic, mechanical, photocopying, recording, or otherwise-without the permission of the Darden Scheel Foundation 147