

Answered step by step
Verified Expert Solution
Question
1 Approved Answer
1. What do you think the main story of the chart is? Does the chart really tell it? Identify any secondary stories. 2. Discuss how
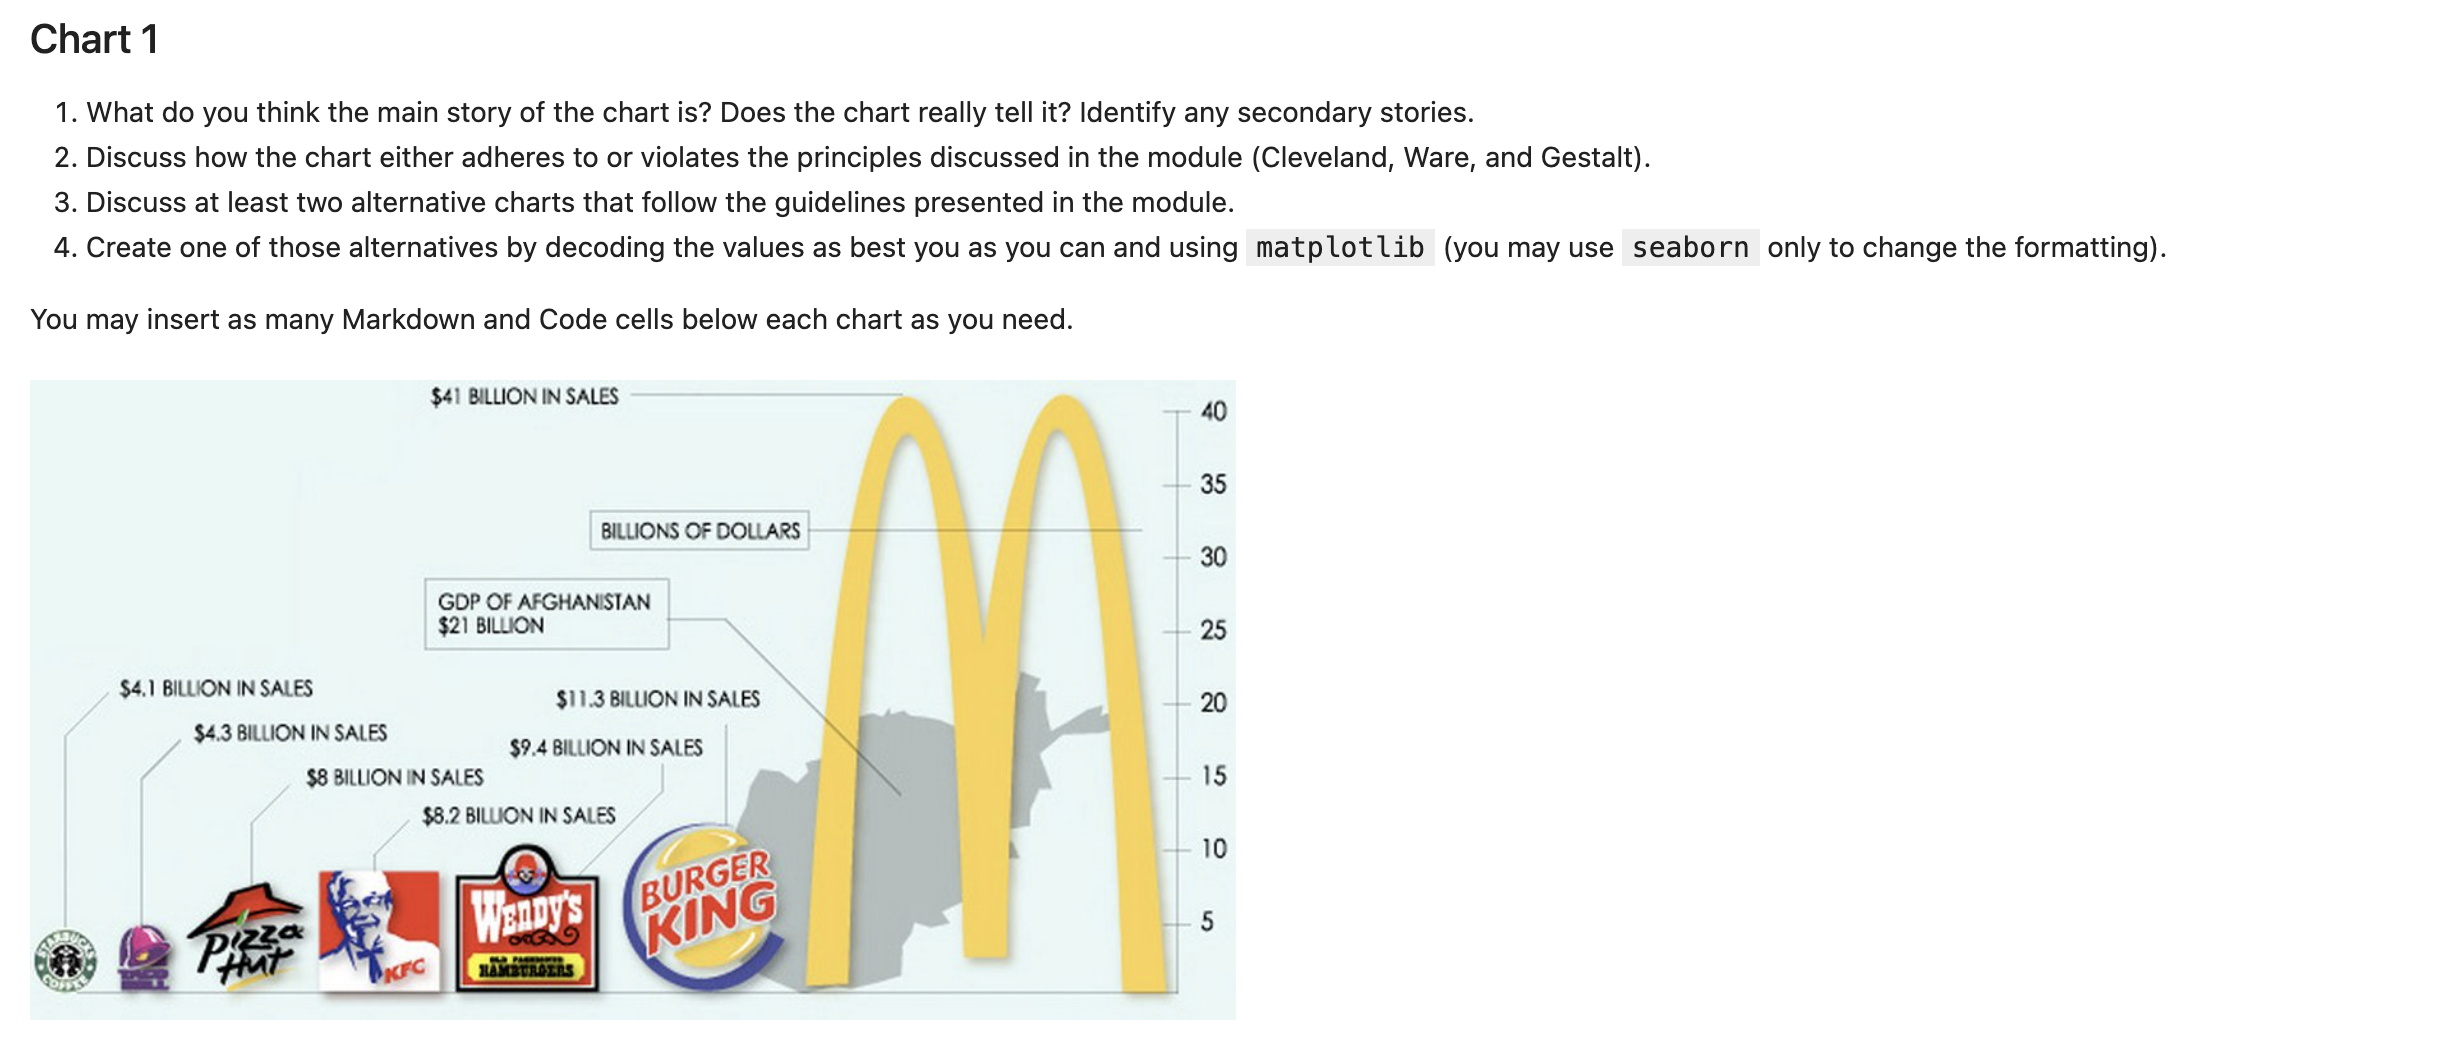 1. What do you think the main story of the chart is? Does the chart really tell it? Identify any secondary stories. 2. Discuss how the chart either adheres to or violates the principles discussed in the module (Cleveland, Ware, and Gestalt). 3. Discuss at least two alternative charts that follow the guidelines presented in the module. 4. Create one of those alternatives by decoding the values as best you as you can and using matplotlib (you may use seaborn only to change the formatting). You may insert as many Markdown and Code cells below each chart as you need
 Step by Step Solution
There are 3 Steps involved in it
Step: 1

Get Instant Access to Expert-Tailored Solutions
See step-by-step solutions with expert insights and AI powered tools for academic success
Step: 2

Step: 3
Ace Your Homework with AI
Get the answers you need in no time with our AI-driven, step-by-step assistance
Get Started
Pricing In General Insurance
Authors: Pietro Parodi
2nd Edition
0367769034,1000860833