Answered step by step
Verified Expert Solution
Link Copied!

Question

1 Approved Answer

1. What form of graph should be used for variables with each of the following levels of measurement? 1.a) discrete nominal - bar chart or

image text in transcribed
1. What form of graph should be used for variables with each of the following levels of measurement? 1.a) discrete nominal - bar chart or bar graph 1.b) discrete ordinal - histogram 1.c) continuous interval-ratio - polygon 2. Calculate the midpoint of each class interval (and report under the m column) and compute N (sample size). Ages of persons enrolled in a work-release program X m f 18-23 20,5 10 24-29 717 24.5 7 30-35 32.5 9 36-41 5 12 38.5 42-47 4 4, 5 8 12 48-53 50.5 54-59 565 2 m 60-65 6205 66-71 67.5 72-77 74.5 50

Step by Step Solution

There are 3 Steps involved in it

Step: 1

blur-text-image

Get Instant Access to Expert-Tailored Solutions

See step-by-step solutions with expert insights and AI powered tools for academic success

Step: 2

blur-text-image

Step: 3

blur-text-image

Ace Your Homework with AI

Get the answers you need in no time with our AI-driven, step-by-step assistance

Get Started

Recommended Textbook for

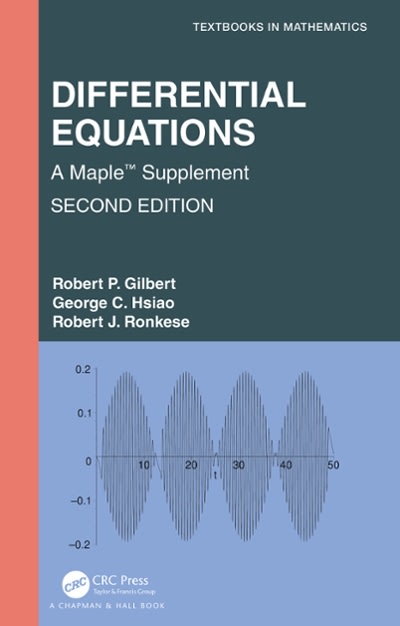
Differential Equations A Maple™ Supplement

Authors: Robert P Gilbert, George C Hsiao, Robert J Ronkese

2nd Edition

1000402525, 9781000402520

More Books

Students also viewed these Mathematics questions

Question

13.6 Explain how to set up aflexible benefits program.

Answered: 1 week ago

Question

13.2 Describe five government-mandated benefits.

Answered: 1 week ago