

Question
1) What is Star Rivers weighted-average cost of capital (WACC)? (Hint: Use CAPM to estimate its Re. Remember the difference between levered and unlevered betas.
 1) What is Star Rivers weighted-average cost of capital (WACC)? (Hint: Use CAPM to estimate its Re. Remember the difference between levered and unlevered betas. Then, calculate WACC with proper Rd and Re.)
Please solve in excel and show formulas if possible
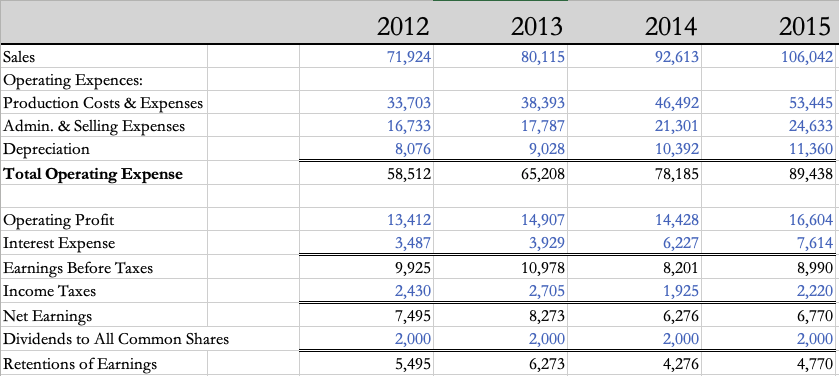
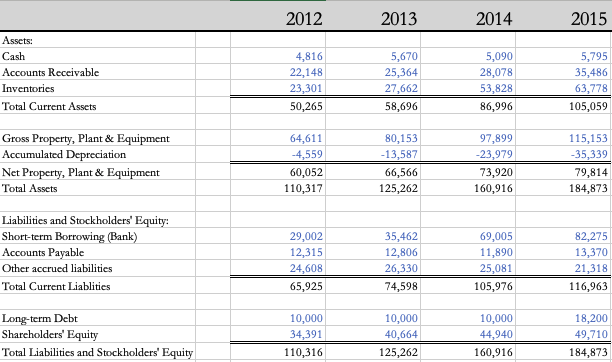
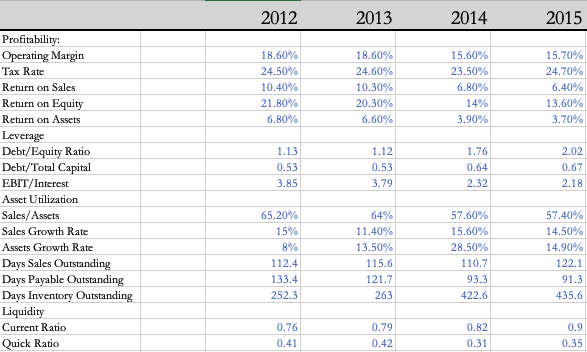
Sales Operating Expences: Production Costs & Expenses Admin. & Selling Expenses Depreciation Total Operating Expense Operating Profit Interest Expense Earnings Before Taxes Income Taxes Net Earnings Dividends to All Common Shares Retentions of Earnings 2012 71,924 33,703 16,733 8,076 58,512 13,412 3,487 9,925 2,430 7,495 2,000 5,495 2013 80,115 38,393 17,787 9,028 65,208 14,907 3,929 10,978 2,705 8,273 2,000 6,273 2014 92,613 46,492 21,301 10,392 78,185 14,428 6,227 8,201 1,925 6,276 2,000 4,276 2015 106,042 53,445 24,633 11,360 89,438 16,604 7,614 8,990 2,220 6,770 2,000 4,770 Assets: Cash Accounts Receivable Inventories Total Current Assets Gross Property, Plant & Equipment Accumulated Depreciation Net Property, Plant & Equipment Total Assets Liabilities and Stockholders' Equity: Short-term Borrowing (Bank) Accounts Payable Other accrued liabilities Total Current Liablities Long-term Debt Shareholders' Equity Total Liabilities and Stockholders' Equity 2012 4,816 22,148 23,301 50,265 64,611 -4,559 60,052 110,317 29,002 12,315 24,608 65,925 10,000 34,391 110,316 2013 5,670 25,364 27,662 58,696 80,153 -13,587 66,566 125,262 35,462 12,806 26,330 74,598 10,000 40,664 125,262 2014 5,090 28,078 53,828 86,996 97,899 -23,979 73,920 160,916 69,005 11,890 25,081 105,976 10,000 44,940 160,916 2015 5,795 35,486 63,778 105,059 115,153 -35,339 79,814 184,873 82,275 13,370 21,318 116,963 18,200 49,710 184,873 Profitability: Operating Margin Tax Rate Return on Sales Return on Equity Return on Assets Leverage Debt/Equity Ratio Debt/Total Capital EBIT/Interest Asset Utilization Sales/Assets Sales Growth Rate Assets Growth Rate Days Sales Outstanding Days Payable Outstanding Days Inventory Outstanding Liquidity Current Ratio Quick Ratio 2012 18.60% 24.50% 10.40% 21.80% 6.80% 1.13 0.53 3.85 65.20% 15% 8% 112.4 133.4 252.3 0.76 0.41 2013 18.60% 24.60% 10.30% 20.30% 6.60% 1.12 0.53 3.79 64% 11.40% 13.50% 115.6 121.7 263 0.79 0.42 2014 15.60% 23.50% 6.80% 14% 3.90% 1.76 0.64 2.32 57.60% 15.60% 28.50% 110.7 93.3 422.6 0.82 0.31 2015 15.70% 24.70% 6.40% 13.60% 3.70% 2.02 0.67 2.18 57.40% 14.50% 14.90% 122.1 91.3 435.6 0.9 0.35 Name Sing Studios, Inc Wintronics, Inc STOR-Max Corp. Digital Media Corp. Wymax, Inc % Sales from OMP P/E Ratio 20% 95% NMF 90% 30% 60% NMF 9 18.2 34.6 Beta 1.1 1.5 1.7 1.2 1.5 Book D/E Book Value per Share Market Price per Share # Shares Outstanding Last Div per share 0.23 1.24 1.37 9.3 1.82 0.15 1.72 1.46 6.39 177.2 1.33 7.06 27.48 8.9 none 48.3 none 0 17.75 75.22 0.42 6.95 22.19 1.57 371.2 Sales Operating Expences: Production Costs & Expenses Admin. & Selling Expenses Depreciation Total Operating Expense Operating Profit Interest Expense Earnings Before Taxes Income Taxes Net Earnings Dividends to All Common Shares Retentions of Earnings 2012 71,924 33,703 16,733 8,076 58,512 13,412 3,487 9,925 2,430 7,495 2,000 5,495 2013 80,115 38,393 17,787 9,028 65,208 14,907 3,929 10,978 2,705 8,273 2,000 6,273 2014 92,613 46,492 21,301 10,392 78,185 14,428 6,227 8,201 1,925 6,276 2,000 4,276 2015 106,042 53,445 24,633 11,360 89,438 16,604 7,614 8,990 2,220 6,770 2,000 4,770 Assets: Cash Accounts Receivable Inventories Total Current Assets Gross Property, Plant & Equipment Accumulated Depreciation Net Property, Plant & Equipment Total Assets Liabilities and Stockholders' Equity: Short-term Borrowing (Bank) Accounts Payable Other accrued liabilities Total Current Liablities Long-term Debt Shareholders' Equity Total Liabilities and Stockholders' Equity 2012 4,816 22,148 23,301 50,265 64,611 -4,559 60,052 110,317 29,002 12,315 24,608 65,925 10,000 34,391 110,316 2013 5,670 25,364 27,662 58,696 80,153 -13,587 66,566 125,262 35,462 12,806 26,330 74,598 10,000 40,664 125,262 2014 5,090 28,078 53,828 86,996 97,899 -23,979 73,920 160,916 69,005 11,890 25,081 105,976 10,000 44,940 160,916 2015 5,795 35,486 63,778 105,059 115,153 -35,339 79,814 184,873 82,275 13,370 21,318 116,963 18,200 49,710 184,873 Profitability: Operating Margin Tax Rate Return on Sales Return on Equity Return on Assets Leverage Debt/Equity Ratio Debt/Total Capital EBIT/Interest Asset Utilization Sales/Assets Sales Growth Rate Assets Growth Rate Days Sales Outstanding Days Payable Outstanding Days Inventory Outstanding Liquidity Current Ratio Quick Ratio 2012 18.60% 24.50% 10.40% 21.80% 6.80% 1.13 0.53 3.85 65.20% 15% 8% 112.4 133.4 252.3 0.76 0.41 2013 18.60% 24.60% 10.30% 20.30% 6.60% 1.12 0.53 3.79 64% 11.40% 13.50% 115.6 121.7 263 0.79 0.42 2014 15.60% 23.50% 6.80% 14% 3.90% 1.76 0.64 2.32 57.60% 15.60% 28.50% 110.7 93.3 422.6 0.82 0.31 2015 15.70% 24.70% 6.40% 13.60% 3.70% 2.02 0.67 2.18 57.40% 14.50% 14.90% 122.1 91.3 435.6 0.9 0.35 Name Sing Studios, Inc Wintronics, Inc STOR-Max Corp. Digital Media Corp. Wymax, Inc % Sales from OMP P/E Ratio 20% 95% NMF 90% 30% 60% NMF 9 18.2 34.6 Beta 1.1 1.5 1.7 1.2 1.5 Book D/E Book Value per Share Market Price per Share # Shares Outstanding Last Div per share 0.23 1.24 1.37 9.3 1.82 0.15 1.72 1.46 6.39 177.2 1.33 7.06 27.48 8.9 none 48.3 none 0 17.75 75.22 0.42 6.95 22.19 1.57 371.2Step by Step Solution
There are 3 Steps involved in it
Step: 1

Get Instant Access to Expert-Tailored Solutions
See step-by-step solutions with expert insights and AI powered tools for academic success
Step: 2

Step: 3
Ace Your Homework with AI
Get the answers you need in no time with our AI-driven, step-by-step assistance
Get Started
Family Enterprise Understanding Families In Business And Families Of Wealth + Online Assessment Tool
Authors: Family Firm Institute
1st Edition
1118730925,1118730984