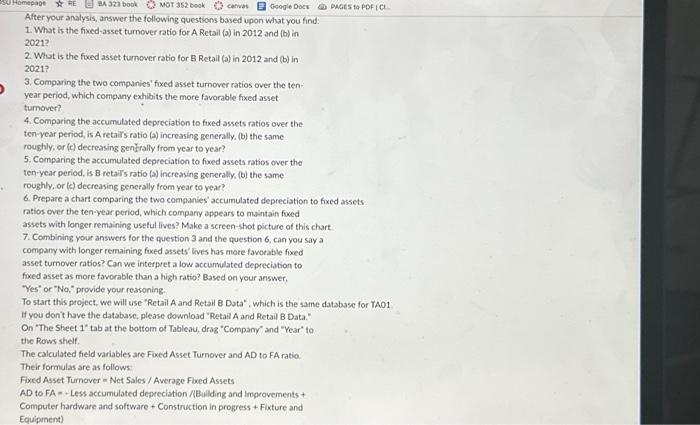
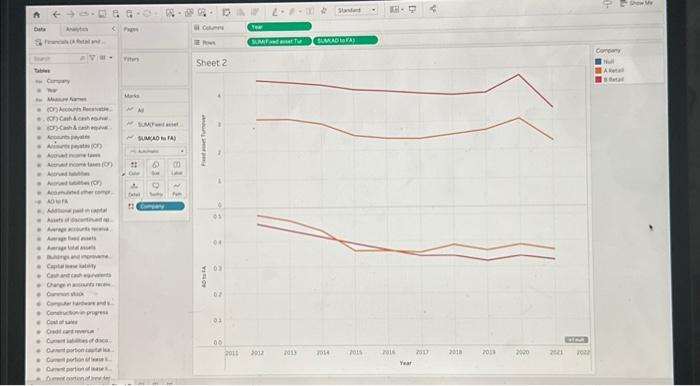
1. What is the fixed-asset turnover ratio for A Retail (a) in 2012 and (b) in 2021? 2. What is the foxed asset turnower ratio for B Retail (a) in 2012 and (b) in 2021 ? 3. Comparing the two companies' fixed asset turnover ratios over the tenyear period, which company exhibits the more favorable fixed asset turnover? 4. Comparing the accumulated depreciation to fuxed assets ratios over the ten-year period, is A retairs ratio (a) increasing generally, (b) the same. roughly, or (c) decreasing gentrally from year to year? 5. Comparing the accumulated depreciation to foxed assets ratios over the ten-year period, is B retairs ratio (a) increasing generally. (b) the same roughly, or (c) decreasing generally from year to year? 6. Prepare a chart comparing the two companies' accumulated depreciation to foxed assets ratios over the ten-year period, which company appears to maintain foced assets with longer remaining useful lives? Make a screen-shot picture of this chart. 7. Combining your answers for the question 3 and the question 6 , can you say a company with longer remaining foxed assets' lives has more favorable foxed asset turnover ratios? Can we interpret a low accumulated depreciation to fixed asset as more favorable than a high ratio? Based on your answer, "Yes" or "Na," provide your reasoning. To start this project, we will use "Retail A and Retail B Duta", which is the same database for TA01 If you don't have the database, please download "Retail A and Retail B Data." On "The Sheet 1" tab at the bottom of Tableau, draz "Company" and "Year" to the Rows shelf. The calculated field variables are Foxed Asset Turnover and AD to FA ratio. Their formulas are as follows: Fixed Asset Turnover = Net Sales / Average Fived Assets AD to FA =+ Less accumulated depreciation / Building and improvements + Computer hardware and soltware + Construction in progress + Fixture and Equipment) 1. What is the fixed-asset turnover ratio for A Retail (a) in 2012 and (b) in 2021? 2. What is the foxed asset turnower ratio for B Retail (a) in 2012 and (b) in 2021 ? 3. Comparing the two companies' fixed asset turnover ratios over the tenyear period, which company exhibits the more favorable fixed asset turnover? 4. Comparing the accumulated depreciation to fuxed assets ratios over the ten-year period, is A retairs ratio (a) increasing generally, (b) the same. roughly, or (c) decreasing gentrally from year to year? 5. Comparing the accumulated depreciation to foxed assets ratios over the ten-year period, is B retairs ratio (a) increasing generally. (b) the same roughly, or (c) decreasing generally from year to year? 6. Prepare a chart comparing the two companies' accumulated depreciation to foxed assets ratios over the ten-year period, which company appears to maintain foced assets with longer remaining useful lives? Make a screen-shot picture of this chart. 7. Combining your answers for the question 3 and the question 6 , can you say a company with longer remaining foxed assets' lives has more favorable foxed asset turnover ratios? Can we interpret a low accumulated depreciation to fixed asset as more favorable than a high ratio? Based on your answer, "Yes" or "Na," provide your reasoning. To start this project, we will use "Retail A and Retail B Duta", which is the same database for TA01 If you don't have the database, please download "Retail A and Retail B Data." On "The Sheet 1" tab at the bottom of Tableau, draz "Company" and "Year" to the Rows shelf. The calculated field variables are Foxed Asset Turnover and AD to FA ratio. Their formulas are as follows: Fixed Asset Turnover = Net Sales / Average Fived Assets AD to FA =+ Less accumulated depreciation / Building and improvements + Computer hardware and soltware + Construction in progress + Fixture and Equipment)