Answered step by step
Verified Expert Solution
Link Copied!

Question

1 Approved Answer

1. What is the graph shown below explaining? Figure 14.10 Annual Stock Returns on Portfolios Sorted by Size (Market Capitalization) from 1926 to 2013 13.4%

1. What is the graph shown below explaining?
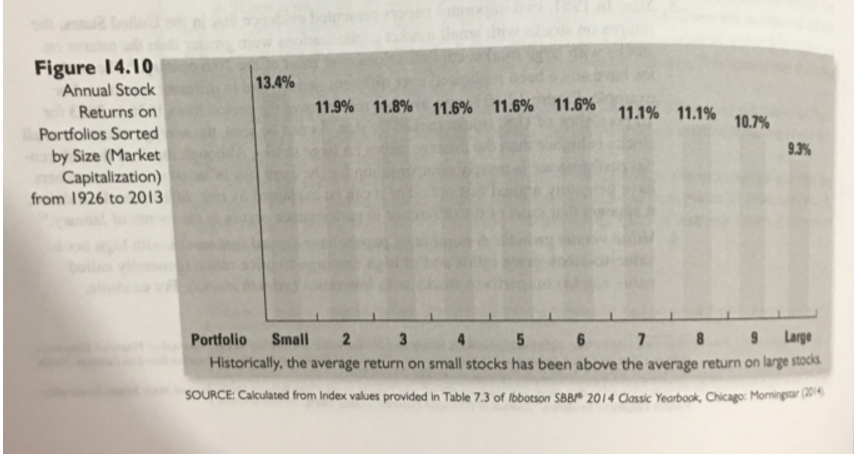
image text in transcribed

Figure 14.10 Annual Stock Returns on Portfolios Sorted by Size (Market Capitalization) from 1926 to 2013 13.4% 11.9% 11.8% 11.6% 11.6% 11.6% 11.1% 11.1% 10.7% Portfolio Small 2 34 5 6 78 Large Historically, the average return on small stocks has been above the average return on large stocks SOURCE: Caculated from Index values provided in Table 7.3 of ibbotson SBB2014 Classic Yebook Chicago Mor prin

Step by Step Solution

There are 3 Steps involved in it

Step: 1

blur-text-image

Get Instant Access to Expert-Tailored Solutions

See step-by-step solutions with expert insights and AI powered tools for academic success

Step: 2

blur-text-image

Step: 3

blur-text-image

Ace Your Homework with AI

Get the answers you need in no time with our AI-driven, step-by-step assistance

Get Started

Recommended Textbook for

The 3 Signal The Investing Technique That Will Change Your Life

Authors: Jason Kelly

1st Edition

0142180955, 978-0142180952

More Books

Students also viewed these Finance questions