Question
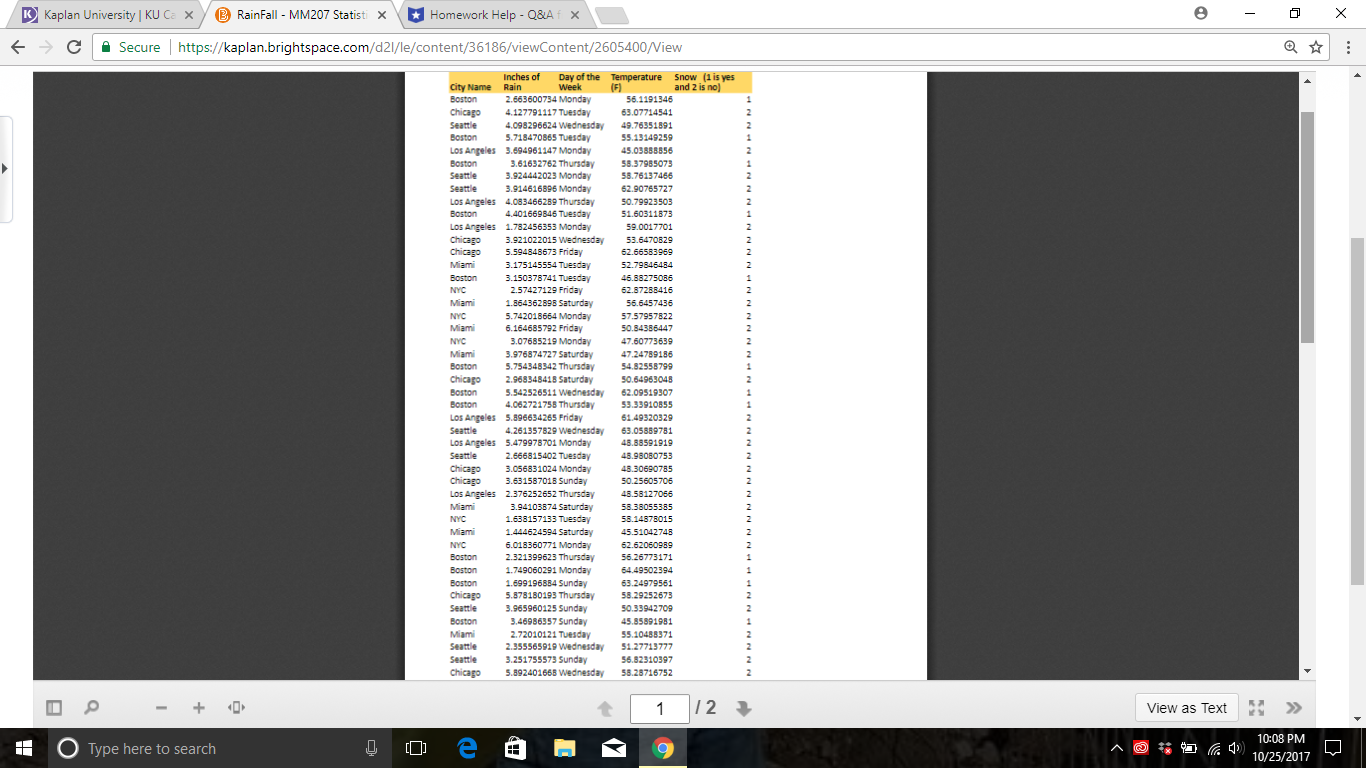
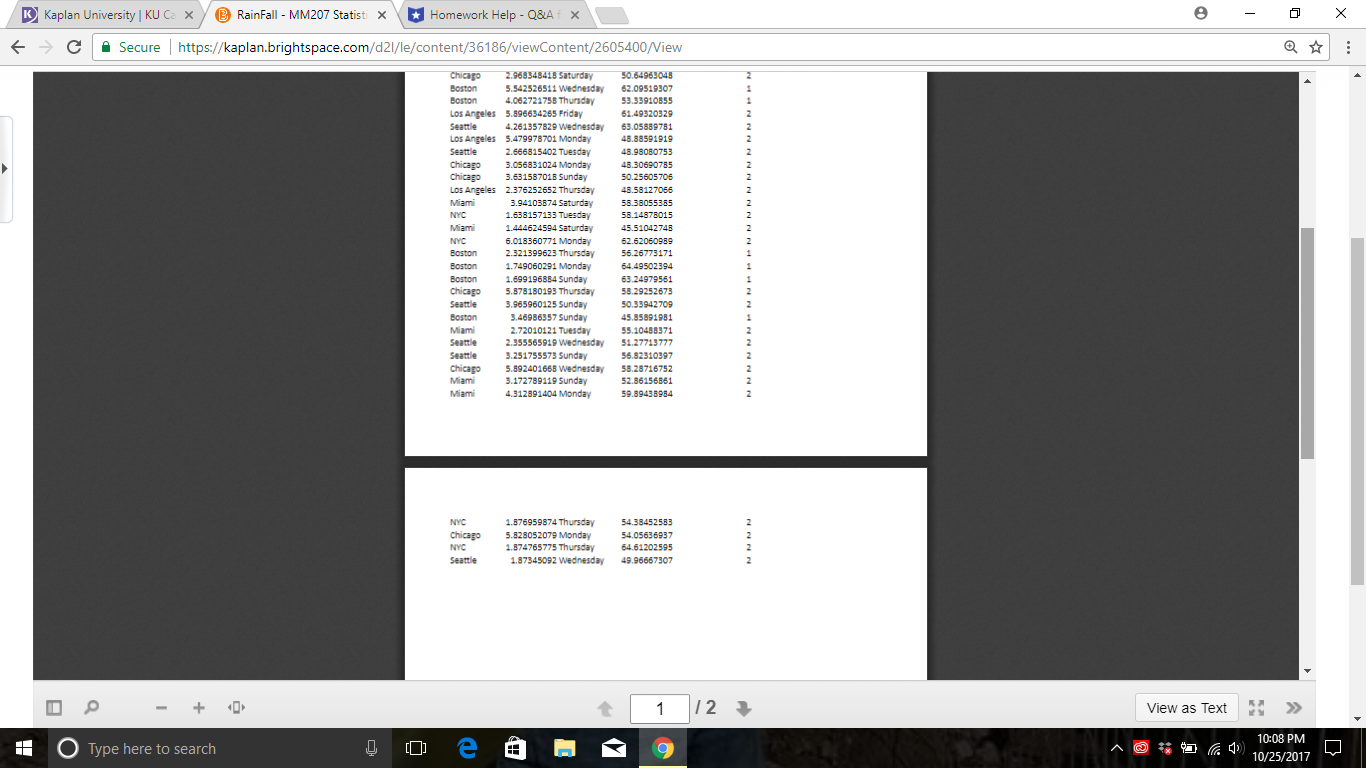
1. What is the name of your dataset? 2. Choose and write down the name of any quantitative and continuous variable from your dataset and
1. What is the name of your dataset?
2. Choose and write down the name of any quantitative and continuous variable from your dataset and use Excel to calculate the mean, median, mode, min, max, range, variance, and standard deviation for that variable. Paste the results into your main post (or use Add/Remove to attach them).
a. Which measure of center (mean, median, or mode) does the best job in describing your variable and why?
b. Which measure of center (mean, median, or mode) does the worst job in describing your variable and why?
c. Include (type in) the value 50000 into your selected variable data. Now, recalculate the mean, median, and the variance for your variable (now that it includes the extra value of 50000). How did this change the mean, median, and variance from their original values? Is the change what you expected?
3. Choose any two quantitative variables from your dataset. Use three numerical measures to compare these two variables. Next, make bar graph that includes the mean and median for both variables (to visualize their comparison).
Please create personalized and substantive responses to at least two other student main posts. In your response, include the following:
- Which measure of center did the student use to best describe their variable? Include the name and type of the variable chosen by the student and explain why you agree or disagree with their choice for best measure of center.
- In number 3 above, the student was asked to choose any two quantitative variables and then for each of the two variables to calculate the mean and median. Next, using the mean and median for the first variable and the mean and median for the second variable, the student creates a bar graph (with four bars). Evaluate and critique the student's graph. What does it tell you about the two variables?


Step by Step Solution
There are 3 Steps involved in it
Step: 1

Get Instant Access to Expert-Tailored Solutions
See step-by-step solutions with expert insights and AI powered tools for academic success
Step: 2

Step: 3

Ace Your Homework with AI
Get the answers you need in no time with our AI-driven, step-by-step assistance
Get Started


