1. What is the required return for KO?
2. What is the selling price in two years?
3. What is the fair value of KO?
4. Please make a Buy or Sell recommendation.

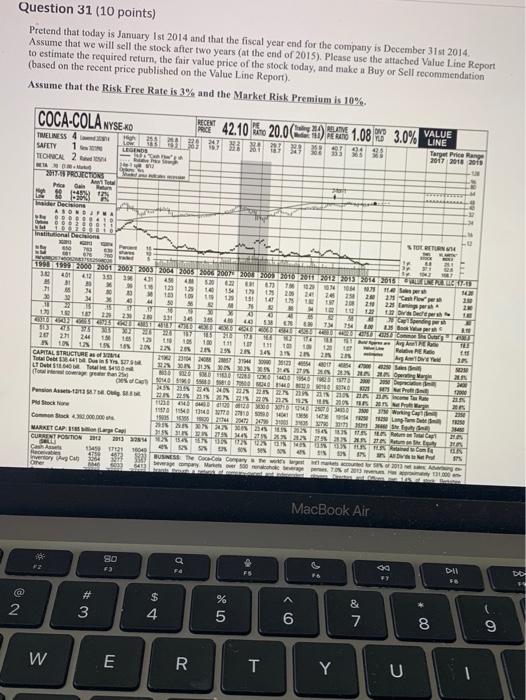
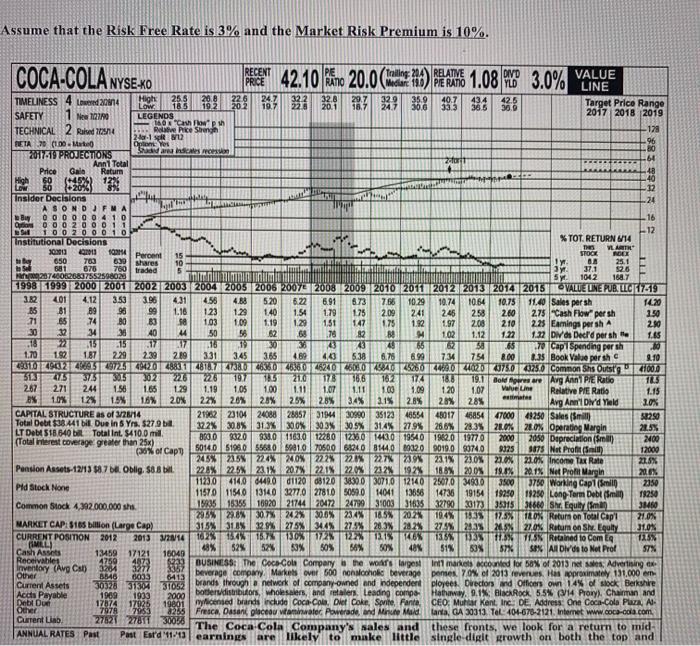
Question 31 (10 points) Pretend that today is January Ist 2014 and that the fiscal year end for the company is December 31st 2014 Assume that we will sell the stock after two years at the end of 2015). Please use the attached Value Line Report to estimate the required return, the fair value price of the stock today, and make a Buy or Sell recommendation (based on the recent price published on the Value Line Report). Assume that the Risk Free Rate is 3% and the Market Risk Premium is 10% COCA-COLA NYSE XD RECENT PRICE THEUNESS 4 SAFETY TONIC 2 42.10. 20.0 () 41.08 3.0% VALEE *** 9 1 LEGENDS LINE Target Price Range 2017 2018 2018 27. PROJECTIONS 4 . w 123 ## 9-53** SORE Institucional TOEBETURN 450 M 2000 2001 2002 2003 2004 2005 2004 2005 2005 30 401 412 419 40 4N 120 022 8T ST 20 * 7 1023 90 123 1064 He 125 M 14 1941 1 M NO 19 133 200 2 10 25 100 24 19 2.00 15 123 34 TET 15 TE 203 30 2:10 2231 1 M M to OD 20 20 18 1 2.30 2N 3.31 346 - 49 TN 751 INC 553 TE 20 2 1 TE 27 244 T 12 150 11 TI 18! 17 1 200 22 2 2 ER 29 CAMTAL STRUCTURE 2 25 To Deus 2002 3 27 LTD To 120 MOM than 20 Lage 10 Contoh Do 21 2000 Pension 2222222 HR AR Stock HSG 20 2005 11011541420 2 10 Lagu 1925 MARKETCAP Car! ES Rent CURRENT POSITION 2013 XANTXOXO SHED TER IN CA 134916040 Alle 4750 AT merry CC BUSINESS Cam One by Me 43 TIDOS SEELER MacBook Air SO F3 . Fa FS IN 56 DO 2 + 3 $ 4 % 5 0 > & 7 8 9 W E R T Y U Assume that the Risk Free Rate is 3% and the Market Risk Premium is 10%. COCA-COLA NYSEXO 87 2. 2018 40723 pl 630 shares ; 103 WS RECENT PE Trailing: 20 RELATIVE DIVO VALUE YLD LINE TIMELINESS Low 2014 High 226 24 Low 185 202 33.3 30.0 Target Price Range SAFETY 1 Ne 12700 LEGENDS 2017 2018 2019 TECHNICAL 2 Raid 2014 160 Cash Towe ... Pike Stregh 128 2.1 W BETA 70 (1.00 - Oto Yes 96 2017-19 PROJECTIONS SUNAN rose Ann1 Total zatorit -64 Price GA Return High (44.5% -40 LOW -12 Insider Decisions -24 A SONDJFMA UTI OOOOOO 4 10 16 On 0 0 0 2 0 0 0 1 1 ES 10 2 0 0 0 1 0 12 Institutional Decisions % TOT. RETURN W14 300013 2018 TOMA THES VLAR Percent 15 STOCK NGEN to be 650 783 10 1 BA 25.1 to se 676 681 760 traded 5 Jy 37.1 526 00267460826807552598020 sy 1042 1887 1998 1999 2000 2001 2002 2003 2004 2005 2006 2007 2008 2009 2010 2011 2012 2013 2014 2015 VALUE UNE PUBLIC 17-19 3.82 401 4.12 3.53 3.96 431 4.56 4.88 5.20 6.22 6.91 5.73 7.66 10 29 10.74 10.64 10.75 81 89 11.40 Sales persh 14.20 98 99 1.16 123 1.29 1.40 1.54 1.79 175 2.09 241 246 258 2.60 71 65 275 Cash Flow per sh 1.50 74 B0 58 1.09 1.19 129 1.51 147 175 1.52 1.97 208 210 30 225 Earnings per shA 2.50 32 34 30 40 44 50 56 62 .78 82 80 102 1.12 1.22 1.85 1.32 DIVs Deeld per she .18 22 15 15 .17 17 116 19 30 43 23 144 65 62 50 265 170 Cap Spending perih 1.70 192 1.87 2.29 2.39 3.31 3.45 3.65 469 40 5.38 6.78 6.99 7.34 754 8.00 1.35 Book Value per she 2.10 31.01 1902 W0725142048830107073806350115360606.09A02526040202750100 Common Shs Outst 61001 2015 373 3013 302 226 197 13 21.0 175 566 162 174 18.8 19.1 Bordwes are Avg Ann P E Radio TE 262 271 244 156 1.65 1.29 1.19 105 1.00 1.11 1.07 1.11 1.00 1.09 120 Valve Line Relative PIE Ratio 1.15 10% 12% 1.5% 16% 20% 22% 20% 20% 25% 28% 34% 3.1% 2.8% 28% 28% es Avg Ann' Did Yield 10% CAPITAL STRUCTURE as of 126/14 25962 23104 24088 289573194 30990 35123 46554 Total Debt $38.441 bil. Due in 5 Yrs. $279 4801746854 47000 49250 Sales (Sill $2250 322% 30.8% 313200% 30.3% 30.5% 31.4% 27.9% 28.6% 23.35 2106 21.0% Operating Margin LT Debt 518.640 Total Int. $4100 mil 21.5% 8500 $32.0 (Total Interest Coverage greater than 25x) 938.01163.0 12280 1290 1430 054 1962.019770 2000 2050 Depreciation (Small 2000 of Capt 5014.051980 5609010705006124081440 19320 9019090740 9925 5875 Not Profit 12000 258 259 22420 222%221% 227 2239% 23,1% 23.0% 20.0% 21.0% Income Tax Rate 228% Pension Assets-12/13 $370. Oblig. 50.8 bil. 228% 22.5%21%207%221%22022%92% 188% 200% 19.1% 20.1% Net Profit Margin 20N Pld Stock None 11230 4140 GMB00112008120383003071012140 2507.037930 3500 3750 Working Cap (Smil 2050 11570 1154013140 3277.0 27810 5050.0 14041 13656 14738 19154 1925 19250 Long Term Debl (Smith) 19250 Common Stock 4,392.000.000 sh. 19836 183551092021744 20472 2479930033109532790301733531531660 Shr, Equity in 3146 235% 2.8% 30.7% 242% 30.6% 234% 16,5%202% 1946 1935 12.5% LOX Return on Total Capt MARKET CAP: 5185 billion (Large Cap 2.0% 315% 31383299276445 27% 20%282%27% 20,35 2.5% 21,0% Return on S. Equity 310 CURRENT POSITION 2012 2013 2014 TOWN 152 16.70 12 15 75 Retained to com 11 52% 52 0 Cash Assets 13459 50% 56% 50% 48 17121 16040 50% 37% 58% AR DI de to Net Prot 57% Receivables 4750 4873 cventory (Avg Cat 32 3377 32 0033 6413 beverage compay Markets over 500 nonchok beverage penses, 70% of 2013 revenues. Has approximately 131.000 Current Assets 30328 334 37052 brands through a network of company-owned and independent ployees. Dvectors and Officers own 14% of stock Berkshire Acets Payable 1989 1903 2000 boter distributors, wholesalers, and retailers. Leading compa Hathaway, 9.1%, Black Rock, 5.5% (V14 Proxy), Chairman and Debt Du 17674 17025 19801 wylicensed brands include Coca-Cola, Diet Coke, Sprite, Fanta, CEOMuttar Kent. Inc. DE. Address One Coca-Cola Plaza. Al Other 7974 7953 8265 Fresca, Oaseni glaceou vitaminwater Powerade and Minute Mald lanta, GA 30313. TeL: 104-678-2121. Internet www.coca-cola.com Current Lab 27627 278 The Coca-Cola Company's sales and these fronts, we look for a return to mid- ANNUAL RATES Past Past Estd 11.13 earnings are likely to make little single digit growth on both the top and 1.02 (ML $18 Other BAR 300% Question 31 (10 points) Pretend that today is January Ist 2014 and that the fiscal year end for the company is December 31st 2014 Assume that we will sell the stock after two years at the end of 2015). Please use the attached Value Line Report to estimate the required return, the fair value price of the stock today, and make a Buy or Sell recommendation (based on the recent price published on the Value Line Report). Assume that the Risk Free Rate is 3% and the Market Risk Premium is 10% COCA-COLA NYSE XD RECENT PRICE THEUNESS 4 SAFETY TONIC 2 42.10. 20.0 () 41.08 3.0% VALEE *** 9 1 LEGENDS LINE Target Price Range 2017 2018 2018 27. PROJECTIONS 4 . w 123 ## 9-53** SORE Institucional TOEBETURN 450 M 2000 2001 2002 2003 2004 2005 2004 2005 2005 30 401 412 419 40 4N 120 022 8T ST 20 * 7 1023 90 123 1064 He 125 M 14 1941 1 M NO 19 133 200 2 10 25 100 24 19 2.00 15 123 34 TET 15 TE 203 30 2:10 2231 1 M M to OD 20 20 18 1 2.30 2N 3.31 346 - 49 TN 751 INC 553 TE 20 2 1 TE 27 244 T 12 150 11 TI 18! 17 1 200 22 2 2 ER 29 CAMTAL STRUCTURE 2 25 To Deus 2002 3 27 LTD To 120 MOM than 20 Lage 10 Contoh Do 21 2000 Pension 2222222 HR AR Stock HSG 20 2005 11011541420 2 10 Lagu 1925 MARKETCAP Car! ES Rent CURRENT POSITION 2013 XANTXOXO SHED TER IN CA 134916040 Alle 4750 AT merry CC BUSINESS Cam One by Me 43 TIDOS SEELER MacBook Air SO F3 . Fa FS IN 56 DO 2 + 3 $ 4 % 5 0 > & 7 8 9 W E R T Y U Assume that the Risk Free Rate is 3% and the Market Risk Premium is 10%. COCA-COLA NYSEXO 87 2. 2018 40723 pl 630 shares ; 103 WS RECENT PE Trailing: 20 RELATIVE DIVO VALUE YLD LINE TIMELINESS Low 2014 High 226 24 Low 185 202 33.3 30.0 Target Price Range SAFETY 1 Ne 12700 LEGENDS 2017 2018 2019 TECHNICAL 2 Raid 2014 160 Cash Towe ... Pike Stregh 128 2.1 W BETA 70 (1.00 - Oto Yes 96 2017-19 PROJECTIONS SUNAN rose Ann1 Total zatorit -64 Price GA Return High (44.5% -40 LOW -12 Insider Decisions -24 A SONDJFMA UTI OOOOOO 4 10 16 On 0 0 0 2 0 0 0 1 1 ES 10 2 0 0 0 1 0 12 Institutional Decisions % TOT. RETURN W14 300013 2018 TOMA THES VLAR Percent 15 STOCK NGEN to be 650 783 10 1 BA 25.1 to se 676 681 760 traded 5 Jy 37.1 526 00267460826807552598020 sy 1042 1887 1998 1999 2000 2001 2002 2003 2004 2005 2006 2007 2008 2009 2010 2011 2012 2013 2014 2015 VALUE UNE PUBLIC 17-19 3.82 401 4.12 3.53 3.96 431 4.56 4.88 5.20 6.22 6.91 5.73 7.66 10 29 10.74 10.64 10.75 81 89 11.40 Sales persh 14.20 98 99 1.16 123 1.29 1.40 1.54 1.79 175 2.09 241 246 258 2.60 71 65 275 Cash Flow per sh 1.50 74 B0 58 1.09 1.19 129 1.51 147 175 1.52 1.97 208 210 30 225 Earnings per shA 2.50 32 34 30 40 44 50 56 62 .78 82 80 102 1.12 1.22 1.85 1.32 DIVs Deeld per she .18 22 15 15 .17 17 116 19 30 43 23 144 65 62 50 265 170 Cap Spending perih 1.70 192 1.87 2.29 2.39 3.31 3.45 3.65 469 40 5.38 6.78 6.99 7.34 754 8.00 1.35 Book Value per she 2.10 31.01 1902 W0725142048830107073806350115360606.09A02526040202750100 Common Shs Outst 61001 2015 373 3013 302 226 197 13 21.0 175 566 162 174 18.8 19.1 Bordwes are Avg Ann P E Radio TE 262 271 244 156 1.65 1.29 1.19 105 1.00 1.11 1.07 1.11 1.00 1.09 120 Valve Line Relative PIE Ratio 1.15 10% 12% 1.5% 16% 20% 22% 20% 20% 25% 28% 34% 3.1% 2.8% 28% 28% es Avg Ann' Did Yield 10% CAPITAL STRUCTURE as of 126/14 25962 23104 24088 289573194 30990 35123 46554 Total Debt $38.441 bil. Due in 5 Yrs. $279 4801746854 47000 49250 Sales (Sill $2250 322% 30.8% 313200% 30.3% 30.5% 31.4% 27.9% 28.6% 23.35 2106 21.0% Operating Margin LT Debt 518.640 Total Int. $4100 mil 21.5% 8500 $32.0 (Total Interest Coverage greater than 25x) 938.01163.0 12280 1290 1430 054 1962.019770 2000 2050 Depreciation (Small 2000 of Capt 5014.051980 5609010705006124081440 19320 9019090740 9925 5875 Not Profit 12000 258 259 22420 222%221% 227 2239% 23,1% 23.0% 20.0% 21.0% Income Tax Rate 228% Pension Assets-12/13 $370. Oblig. 50.8 bil. 228% 22.5%21%207%221%22022%92% 188% 200% 19.1% 20.1% Net Profit Margin 20N Pld Stock None 11230 4140 GMB00112008120383003071012140 2507.037930 3500 3750 Working Cap (Smil 2050 11570 1154013140 3277.0 27810 5050.0 14041 13656 14738 19154 1925 19250 Long Term Debl (Smith) 19250 Common Stock 4,392.000.000 sh. 19836 183551092021744 20472 2479930033109532790301733531531660 Shr, Equity in 3146 235% 2.8% 30.7% 242% 30.6% 234% 16,5%202% 1946 1935 12.5% LOX Return on Total Capt MARKET CAP: 5185 billion (Large Cap 2.0% 315% 31383299276445 27% 20%282%27% 20,35 2.5% 21,0% Return on S. Equity 310 CURRENT POSITION 2012 2013 2014 TOWN 152 16.70 12 15 75 Retained to com 11 52% 52 0 Cash Assets 13459 50% 56% 50% 48 17121 16040 50% 37% 58% AR DI de to Net Prot 57% Receivables 4750 4873 cventory (Avg Cat 32 3377 32 0033 6413 beverage compay Markets over 500 nonchok beverage penses, 70% of 2013 revenues. Has approximately 131.000 Current Assets 30328 334 37052 brands through a network of company-owned and independent ployees. Dvectors and Officers own 14% of stock Berkshire Acets Payable 1989 1903 2000 boter distributors, wholesalers, and retailers. Leading compa Hathaway, 9.1%, Black Rock, 5.5% (V14 Proxy), Chairman and Debt Du 17674 17025 19801 wylicensed brands include Coca-Cola, Diet Coke, Sprite, Fanta, CEOMuttar Kent. Inc. DE. Address One Coca-Cola Plaza. Al Other 7974 7953 8265 Fresca, Oaseni glaceou vitaminwater Powerade and Minute Mald lanta, GA 30313. TeL: 104-678-2121. Internet www.coca-cola.com Current Lab 27627 278 The Coca-Cola Company's sales and these fronts, we look for a return to mid- ANNUAL RATES Past Past Estd 11.13 earnings are likely to make little single digit growth on both the top and 1.02 (ML $18 Other BAR 300%


