Question
1. What title does Apple give to its income statements? 2. Perform a vertical analysis on Apples income statement for fiscal years 2017 and 2016.
1. What title does Apple give to its income statements? 2. Perform a vertical analysis on Apples income statement for fiscal years 2017 and 2016. That is, using Net Sales as the base, convert each amount shown on the 2017 and 2016 income statements to a percentage of net sales. You should carry your analysis down to the line item labeled Net income. (You do not need to perform the analysis for fiscal year 2015.)
3.Why would an investor want to perform a vertical analysis each year on a companys income statement?
4. Perform a horizontal analysis on the income statements to measure the changes (in terms of dollars and percentages) for each line item from fiscal year 2016 to fiscal year 2017. (You do not need to measure the changes from 2015 to 2016.)
5. Why would an investor want to perform horizontal analysis each year on a companys income statement?
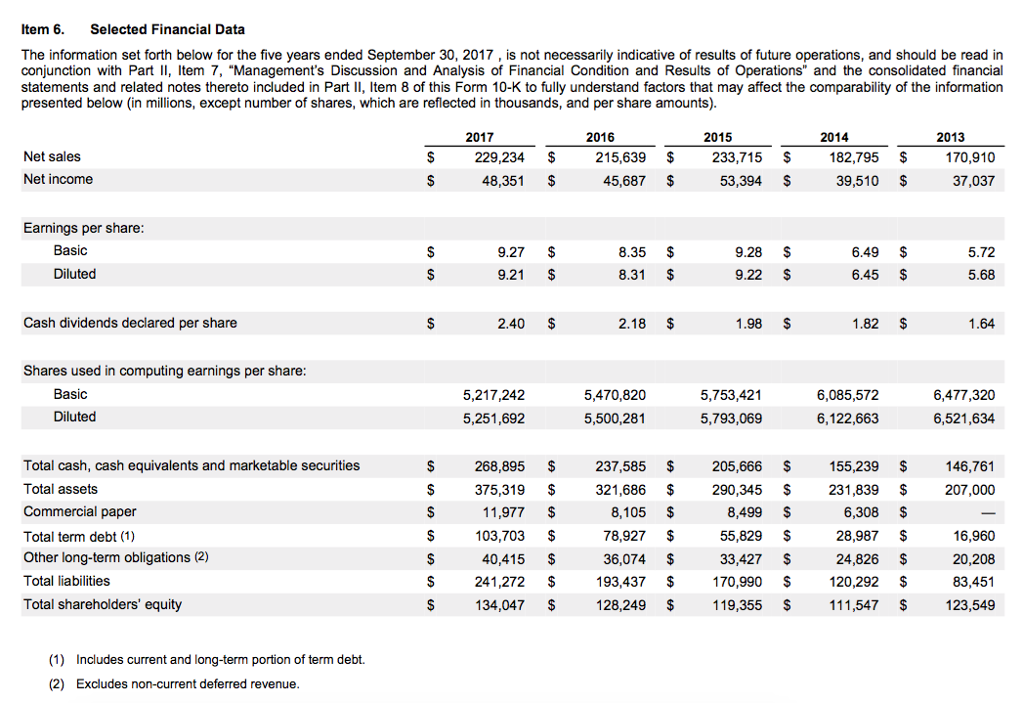
Item 6. Selected Financial Data The information set forth below for the five years ended September 30, 2017, is not necessarily indicative of results of future operations, and should be read in conjunction with Part tem 7, "Management's Discussion and Analysis of Financial Condition and Results of Operations" and the consolidated financial statements and related notes thereto included in Part II, Item 8 of this Form 10-K to fully understand factors that may affect the comparability of the information presented below (in millions, except number of shares, which are reflected in thousands, and per share amounts) 2017 2016 2015 2014 2013 Net sales 229,234 $ 48,351 $ 215,639 233,715 $182,795 $170,910 37,037 Net income 45,687 $ 53,394 $ 39,510 $ Earnings per share Basic 9.27$ 9.21 $ 8.35 $ 8.31 $ 9.28 S 9.22 $ 6.49 $ 6.45 $ 5.72 5.68 Diluted Cash dividends declared per share 2.40 $ 2.18 $ 1.98 S 1.82 $ 1.64 Shares used in computing earnings per share Basic Diluted 5,217,242 5,251,692 5,470,820 5,500,281 5,753,421 5,793,069 6,085,572 6,122,663 6,477,320 6,521,634 Total cash, cash equivalents and marketable securities Total assets Commercial paper Total term debt (1) Other long-term obligations (2) Total liabilities Total shareholders' equity 268,895 $ 375,319 $ 11,977 $ 103,703 $ 40,415 $ 241,272 $ 134,047 $ 237,585 $ 205,666 $ 155,239 $ 146,761 321,686 $290,345 $231,839 $207,000 6,308 $ 28,987 $ 24,826 $ 93,437$170,990 120,292 $ 16,960 20,208 83,451 128,249 $119,355 $ 111,547 $123,549 8,105 $ 78,927 $ 36,074 S 8,499 $ 55,829 S 33,427 $ (1) (2) Includes current and long-term portion of term debt. Excludes non-current deferred revenueStep by Step Solution
There are 3 Steps involved in it
Step: 1
Get Instant Access to Expert-Tailored Solutions
See step-by-step solutions with expert insights and AI powered tools for academic success
Step: 2
Step: 3
Ace Your Homework with AI
Get the answers you need in no time with our AI-driven, step-by-step assistance
Get Started